

Last week, I conducted training for a company that integrates robotic palletizing cells. While discussing safety functions, I said that combining three devices, each with PL e, does not necessarily result in PL e for the entire function.
This came as a surprise. The participants were convinced that they had been determining the Performance Level correctly. They selected PL e devices and expected the function built from them to achieve the same level. If no component had a lower letter, how could the result be lower?
The missing piece of engineering work lay precisely between the parameters of the individual devices and the result of combining them.
I appreciate that they used such devices and came to verify their knowledge. Some contractors do not even check the parameters of the equipment they select. However, other people’s negligence does not reduce the requirements for our own design. You can be more diligent than your competitors and still assess a safety function incorrectly.
For a series connection of subsystems with known PFH values—the average frequency of a dangerous failure per hour—ISO 13849-1 requires their sum to be taken into account. The individual subsystems may fall within the PL e range, while their sum does not. No device manufacturer needs to provide false information for this to happen. It may be the integrator’s conclusion that is incorrect.
This is not an academic exercise involving powers of ten. The result concerns a function on which a person working at the machine is expected to rely. If PL e is required but the achieved level has not been demonstrated, three data sheets bearing the letter e do not settle the matter.
Good devices were purchased. A ready-made safety justification for the integrator’s own machine was not purchased with them.
This becomes particularly important when the declaration of conformity refers to ISO 13849-1. After all, the recipient is not given a list of standards the supplier has heard of. The recipient is given information about the standards applied in the assessment and construction of the supplied machine.
If the manufacturer presents such a reference as confirmation that the requirements of the standard have been met, even though the safety function assessment was replaced by reading PL values from data sheets, the manufacturer misleads the user. Good faith may explain why the error was made. It does not provide the missing confirmation.
The point is not to start buying even more expensive safety relays after reading this example. First, it is necessary to determine what is required of the function, which components implement it, and what actually results from combining them. Then it is necessary to verify the conditions under which that result remains justified—including after several years and hundreds of thousands of switching operations.
This discussion prompted me to write this article. PL calculation according to ISO 13849-1 must finally be explained in a way that ensures familiarity with the abbreviations is accompanied by an understanding of the actual system. A category is not another way of expressing PL. The result for a relay is not the result for the entire function. And a correct calculation result does not remove the need to maintain the conditions under which it was obtained.
The user needs a function with a demonstrated safety level—not three devices, each of which is convincing on its own.
1. Three PL e devices. Let us see what happens when we add the values
Consider a safety function implemented by three subsystems: detection, logic, and an output that performs the intended response. Each subsystem has been assessed separately as PL e. Each is necessary for the entire function to perform its task correctly.
This is what a series connection means here. It does not mean three contacts connected by a single wire or three devices that can replace one another.
We will assume that the subsystems have been applied correctly and that the remaining requirements have been met. We will not look for an incorrectly connected wire or disabled diagnostics. We will check whether, even under these favorable conditions, three letters e are enough to obtain a fourth—the most important one.
The letters are the same. The numbers are not
PL e does not represent a single, identical PFH value for every device. Different values for the average frequency of a dangerous failure per hour may correspond to the same level.
Let us use the following data for the calculation example:
| Subsystem | Assessed PL | PFH [h−1] |
|---|---|---|
| Detection | e | 3 × 10⁻⁸ |
| Logic | e | 4 × 10⁻⁸ |
| Output | e | 5 × 10⁻⁸ |
All values are lower than 10−7 h−1, which means that they meet the numerical criterion for PL e.
If the verification ended with the last row, success could be declared. Each supplier provided a suitable subsystem. The purchasing decisions appear sound.
However, the user will rely on their combined operation, not on three separate data sheets.
When the PFH values of all subsystems forming such a connection are known, the values must be added together.
PFH = PFH1 + PFH2 + PFH3
PFH = (3 + 4 + 5) × 10−8 = 1,2 × 10⁻⁷ h−1.
For PL e, the sum must be lower than 10−7 h−1. Our result is higher. It falls within the PL d range:
10−7 ≤ PFH < 10−6 h−1.
Each subsystem has PL e. The combination in this example achieves PL d. Not because any manufacturer overstated the parameters, but because the contribution of all three subsystems must be taken into account when assessing the combination.
Nor is the matter settled by the assertion that “the whole system has the level of its weakest component.” The standard limits the result both by the lowest PL of any subsystem and by the level resulting from the sum of the PFH values. The lowest PL of a subsystem limits the result; it does not guarantee that the result will be achieved.
Three devices do not always mean a reduction to PL d
Let us not replace one error with another. The number of devices alone does not determine the result.
For three other subsystems, also assessed as PL e, let us assume values of 2 × 10⁻⁸, 3 × 10⁻⁸ and 4 × 10⁻⁸ h−1:
PFH = (2 + 3 + 4) × 10−8 = 9 × 10⁻⁸ h−1.
This sum remains below 10−7 h−1. Provided that the other assumed conditions are met, the combination can achieve PL e.
The difference becomes very clear when all the numbers are expressed on the same scale. The limit is 10 × 10−8. In the first example, the total was 12; in the second, it was 9. If the result is exactly 10 × 10−8, it is already within the PL d range. The table uses “less than,” not “less than or equal to.”
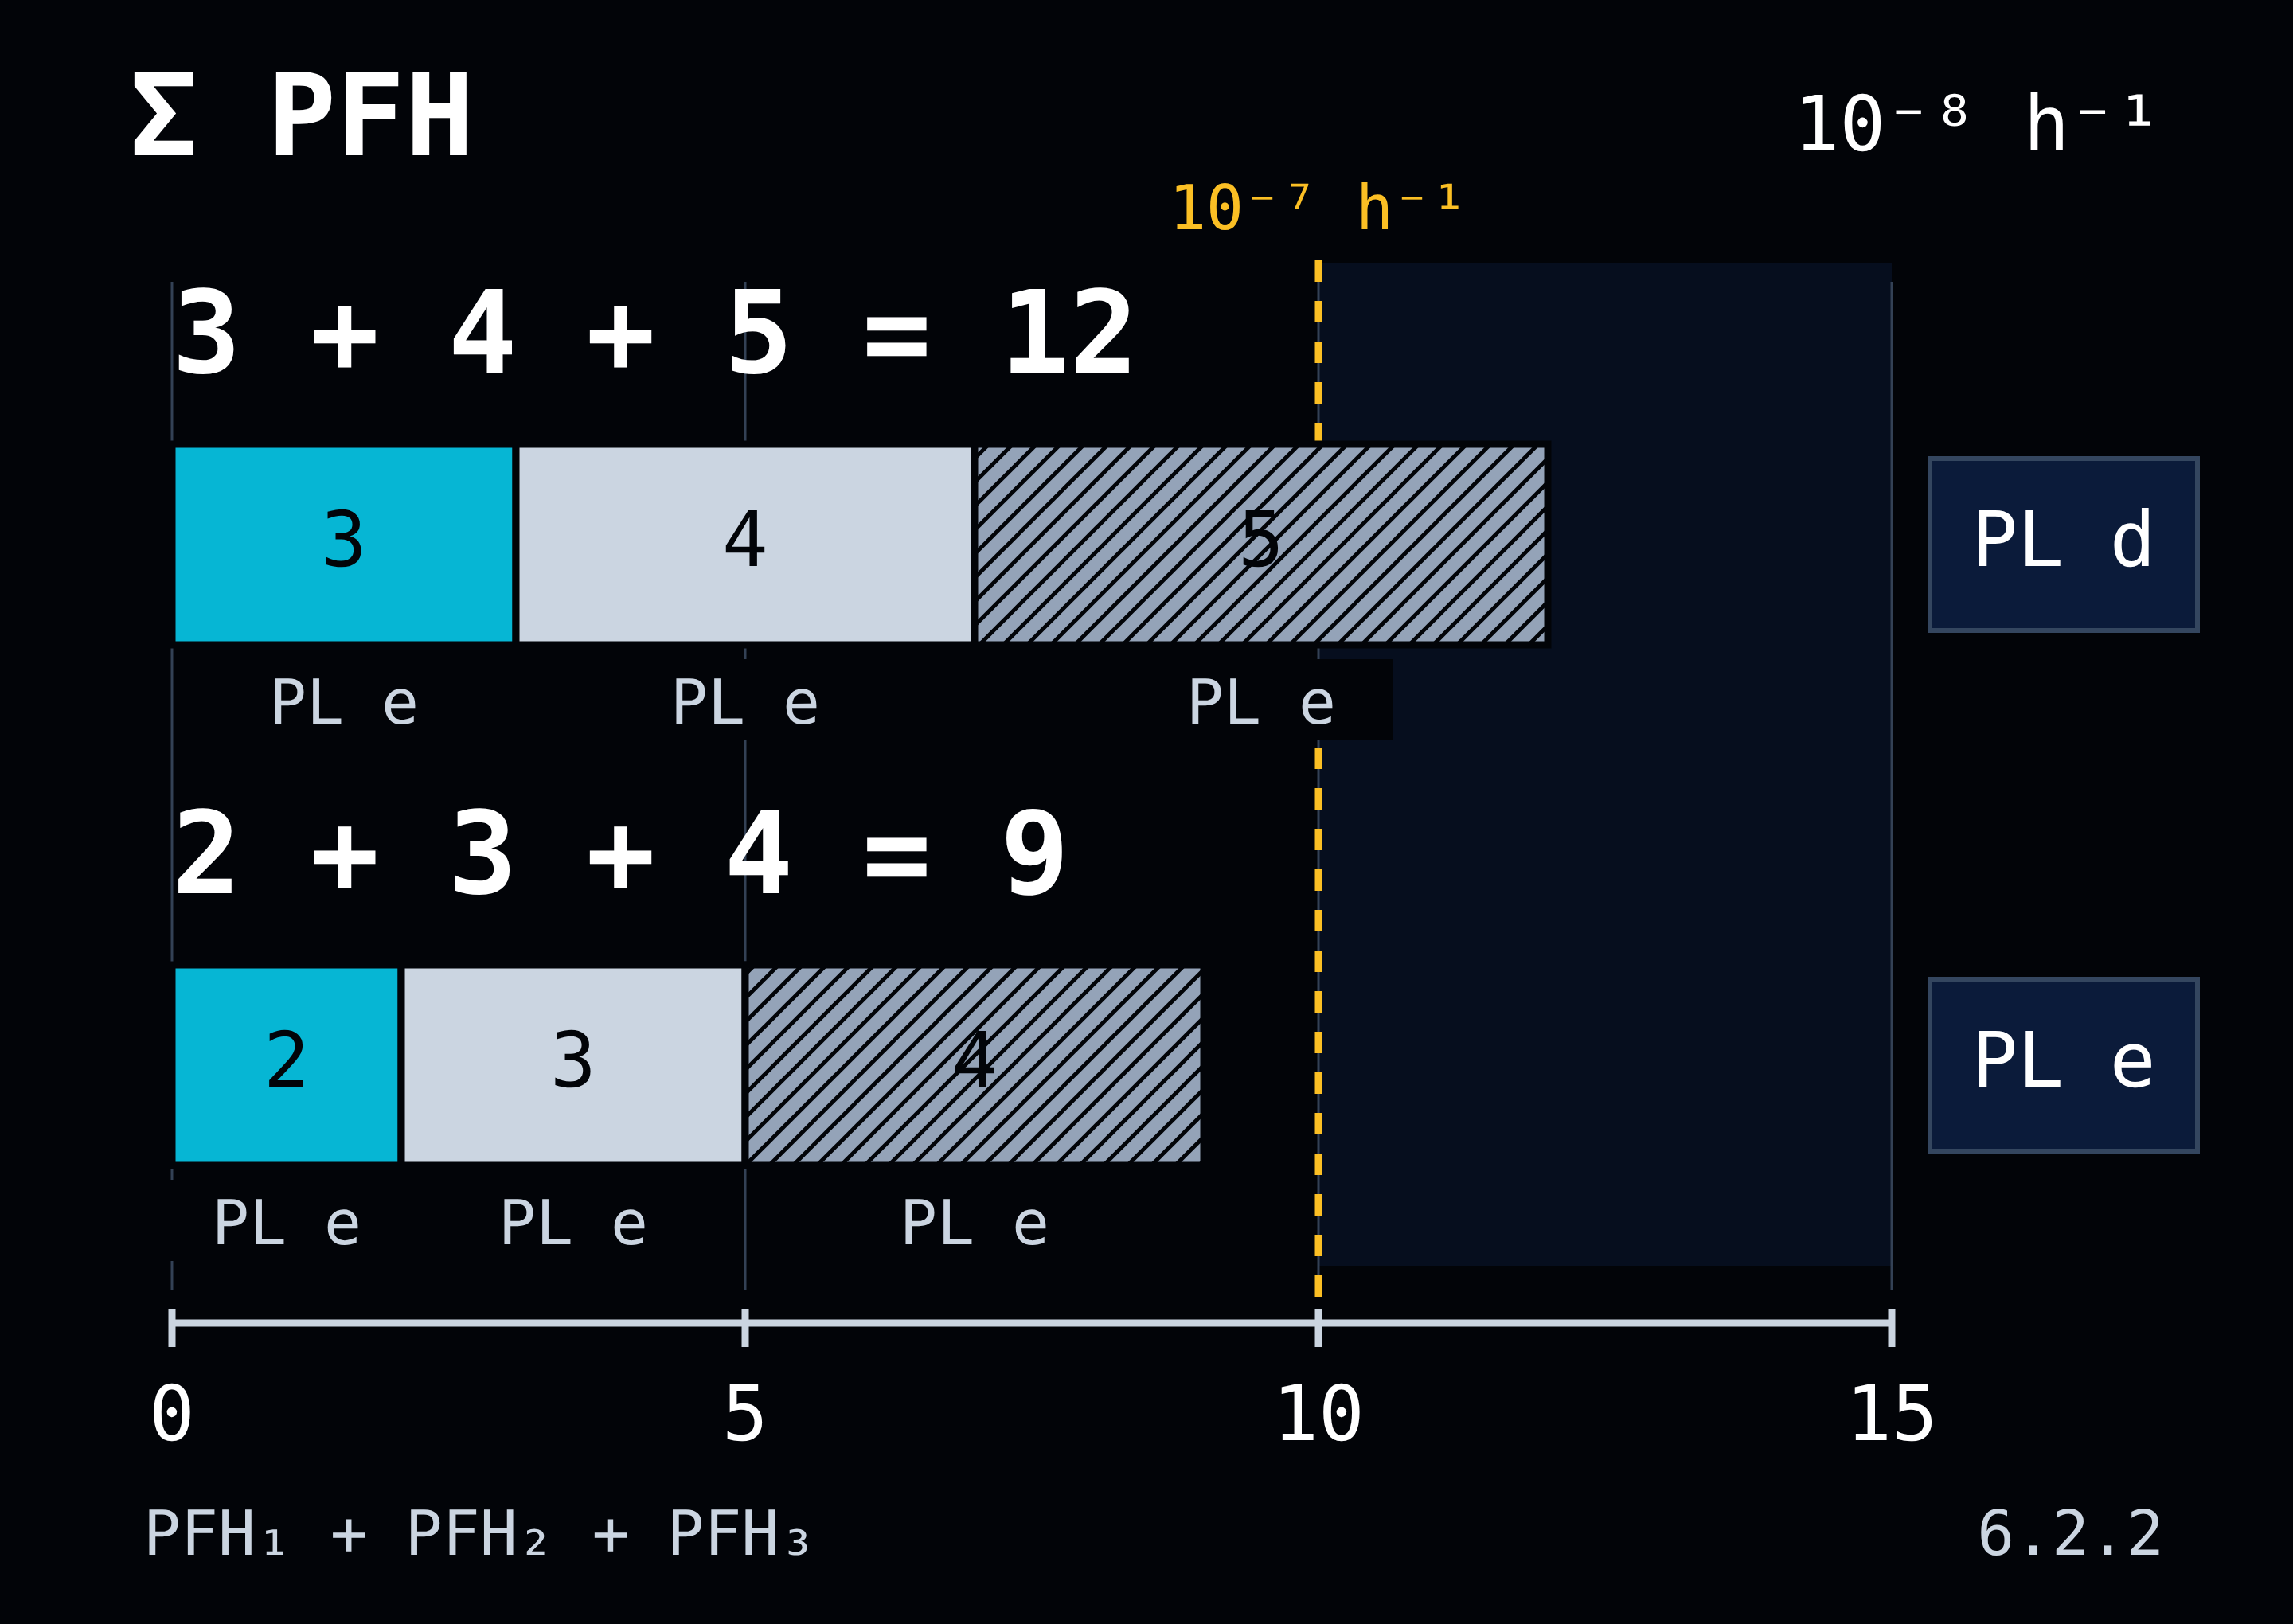
In both variants, the bill of materials lists PL e three times. Only the numbers reveal that the purchased equipment does not provide the same result.
PFH does not determine the date of the next failure
With numbers this small, it is easy to feel excessively safe. If the PFH is 10−8 h−1, someone might interpret this as an assurance that the device will operate without a dangerous failure for one hundred million hours.
That interpretation would be incorrect.
PFH describes the average frequency of a dangerous failure in the implementation of a specified safety function. It does not specify when the first failure will occur. Nor is it the probability of an accident each time a guard is opened.
One hundred million hours is not a warranty period. A dangerous failure may occur much sooner.
Therefore, we do not convert a low PFH into an assurance that “nothing will happen for the next several hundred years.” The standard provides a parameter for assessing the system’s ability to perform the function. It does not provide a basis for assigning the machine a calendar of accident-free operation.
Required e, calculated d. What do we change?
Assume that the required PLr e has been established for the safety function under consideration. The PL d result from the first example is then insufficient. If the achieved PL does not meet the requirement, the design process must be revisited.
First, we verify that the model includes the correct subsystems and that the data used correspond to the applied configuration and operating conditions. If they do, the solution must be changed.
The calculation even shows what we need. If the first two values remain unchanged—3 × 10⁻⁸ and 4 × 10⁻⁸ h−1—the third subsystem must have a PFH less than 3 × 10⁻⁸ h−1 for the sum alone to remain within the PL e range. Ordering another device designated as PL e is not enough. It may have exactly the PFH value that causes the limit to be exceeded again.
“We replaced it with another PL e device” describes a purchase. Only recalculation will show whether the problem has been solved.
We do not remove from the model a subsystem that is still required to perform the function. Nor do we reduce the required PLr because the selected equipment cannot achieve it. If PL e is required but a sound assessment produces PL d, the design must be corrected—not the way the result is recorded.
In this example, simple addition was enough to challenge the claim of PL e. It is worth performing that calculation before signing off the documentation.
2. Category 4 of what? The relay or the designed system?
“We have Category 4. The relay is safety-rated.”
This may be true of the selected device. It still does not explain what is connected to its inputs, what its outputs control, or what will happen if any of these elements fail.
The relay may correctly switch off its outputs. If the only contactor disconnecting the drive fails to open its main contacts, the command from the relay alone will not disconnect power from the motor.
This is not a criticism of the relay. Treating its parameters as an assessment of the entire function was the designer’s decision. The device manufacturer did not design the rest of the circuit on the designer’s behalf.
Define the task first. Then select the devices that perform it
Consider a simple example of access protection for a conveyor drive. Opening the guard must stop the hazardous movement, while leaving it open must prevent the movement from starting. The time required to reach the safe state must be appropriate for the access conditions: a person must not be able to reach the movement against which the function is intended to provide protection.
Only after defining the task in this way do we specify its implementation: a sensor detects the state of the guard, a safety relay processes the signals, and output elements act on the drive. The specification must define, among other things, the initiating event, the response, the required PLr, the time required to reach the safe state, and the operating modes in which the function is active. The relay’s part number does not contain these specifications for our machine.
“Guard connected to safety” describes a connection. It does not yet explain what hazard the person is being protected against or how that protection is provided.
When assessing the system, we also do not stop at the output terminals of the relay. The definition of an SRP/CS covers the path from the initiation of safety-related signals to the outputs of the power control elements—for example, the main contacts of a contactor.
Therefore, if a contactor is to perform the disconnection, it does not become “ordinary electrical equipment outside the safety system” merely because it appears on the next page of the schematic.
Two contactors are not two PL e subsystems
Now consider a variant with two contactors: K₁ and K₂. Their main contacts are connected in series in the motor power circuit, but each contactor can interrupt this circuit independently. If K₁ fails to open its contacts, K₂ can still perform the disconnection.
Connected in series in the power circuit does not mean connected in series in the reliability model.
In such a solution, K₁ and K₂ can form two redundant channels of one output subsystem. Their purpose is to maintain the ability to disconnect despite a specified fault in one channel. This differs from the three subsystems discussed in the previous section, each of which was necessary to perform the function.
It is therefore not sufficient to take two values for individual contactors and apply the addition method intended for a series connection of evaluated subsystems. The output subsystem must first be evaluated in terms of its structure, component reliability, diagnostics, and behavior under fault conditions. Only then is its result used to evaluate the connection with the sensing and logic subsystems. The standard provides for this separation between subsystem evaluation and the evaluation of subsystem combinations.
The question of continued operation after a K₁ fault also remains. Will the system detect that the contactor failed to execute the command? What will it do with this information? Will it allow another cycle to start?
Adding a second contactor provides a second means of disconnection. It does not automatically provide diagnostics or justify a category.
The category describes fault resistance. PL accounts for more
The category classifies a subsystem in terms of its resistance to faults and its behavior after they occur. Structure, fault detection, and reliability are relevant. It is not merely the number of channels or another designation for PL.
For Category 3, a single fault must not lead to the loss of the implemented subfunction. It should be detected no later than at the next demand upon the function, whenever reasonably practicable. However, this does not mean that all faults are detected; the accumulation of undetected faults may lead to the loss of the subfunction.
Category 4 imposes more stringent requirements: if a single fault cannot be detected at the required time, the accumulation of undetected faults must not lead to the loss of the function. High DCavg and high MTTFD are also required for each redundant channel.
Two contactors are visible when the enclosure is opened. Compliance with these requirements cannot be established merely by looking at two contactors.
Determining the PL also involves all relevant aspects of the evaluation: reliability data, diagnostic effectiveness, measures against common cause failures, software, and the prevention of systematic failures. Specifying a category does not replace this scope of evaluation.
The same Category 3, but a result of c, d, or e
Instead of stopping at the statement that “PL depends on many factors,” let us examine specific values.
For a Category 3 architecture, with DCavg = 90% and the other assumptions of the method satisfied, the following results are obtained depending on the MTTFD of each channel:
| MTTFD of each channel | Subsystem PFH [h−1] | PL |
|---|---|---|
| 10 years | 1,36 × 10⁻⁶ | c |
| 30 years | 2,65 × 10⁻⁷ | d |
| 100 years | 4,29 × 10⁻⁸ | e |
These values are taken from the standard model; they are not the results of an evaluation of specific contactors. The category remained the same. The diagnostic coverage also remained the same. The channel reliability changed, and three different PL values were obtained.
MTTFD is a reliability parameter here, not a device replacement interval. We will return to this distinction when discussing the number of cycles and service life.
The table also shows why the shortcut “Category 3 means PL d” is incorrect in both directions. Category 3 does not guarantee d, but neither does it rule out e. The conditions for achieving the result must be demonstrated.
Finally, let us return to the relay. If we use a previously evaluated subsystem, we do not have to reconstruct its design and calculate every internal component from scratch. We must, however, know the scope of the evaluation, apply it correctly, and evaluate its connection with the rest of the system. The standard permits previously validated subsystems to be combined with subsystems designed by the integrator.
The relay manufacturer’s work does not need to be repeated. The part of the work that the relay manufacturer has not done for us must still be performed.
The question was what would happen after a component in the machine failed. The response presented the relay category. That is still not an answer to the question asked.
3. The required PLr does not follow from what has already been purchased
“We achieved PL d. That should be enough.”
Perhaps. But this is determined neither by the calculation result nor by the belief that high-quality devices have been used.
PLr specifies the requirement for a specific safety function. PL describes the level achieved by the system implementing that function. First, the necessary risk reduction must be established. Only then should the solution be designed and demonstrated to meet the requirement.
If the relay has already been ordered, the circuit diagram is complete, and the required level is only then being selected, it is easy to reverse this sequence. The evaluation parameters then begin to fit the capabilities of the purchased equipment suspiciously well.
Adapting the requirement to the result already achieved avoids having to revise the design. It does not demonstrate that the design is correct.
S2 is not reserved for fatal accidents
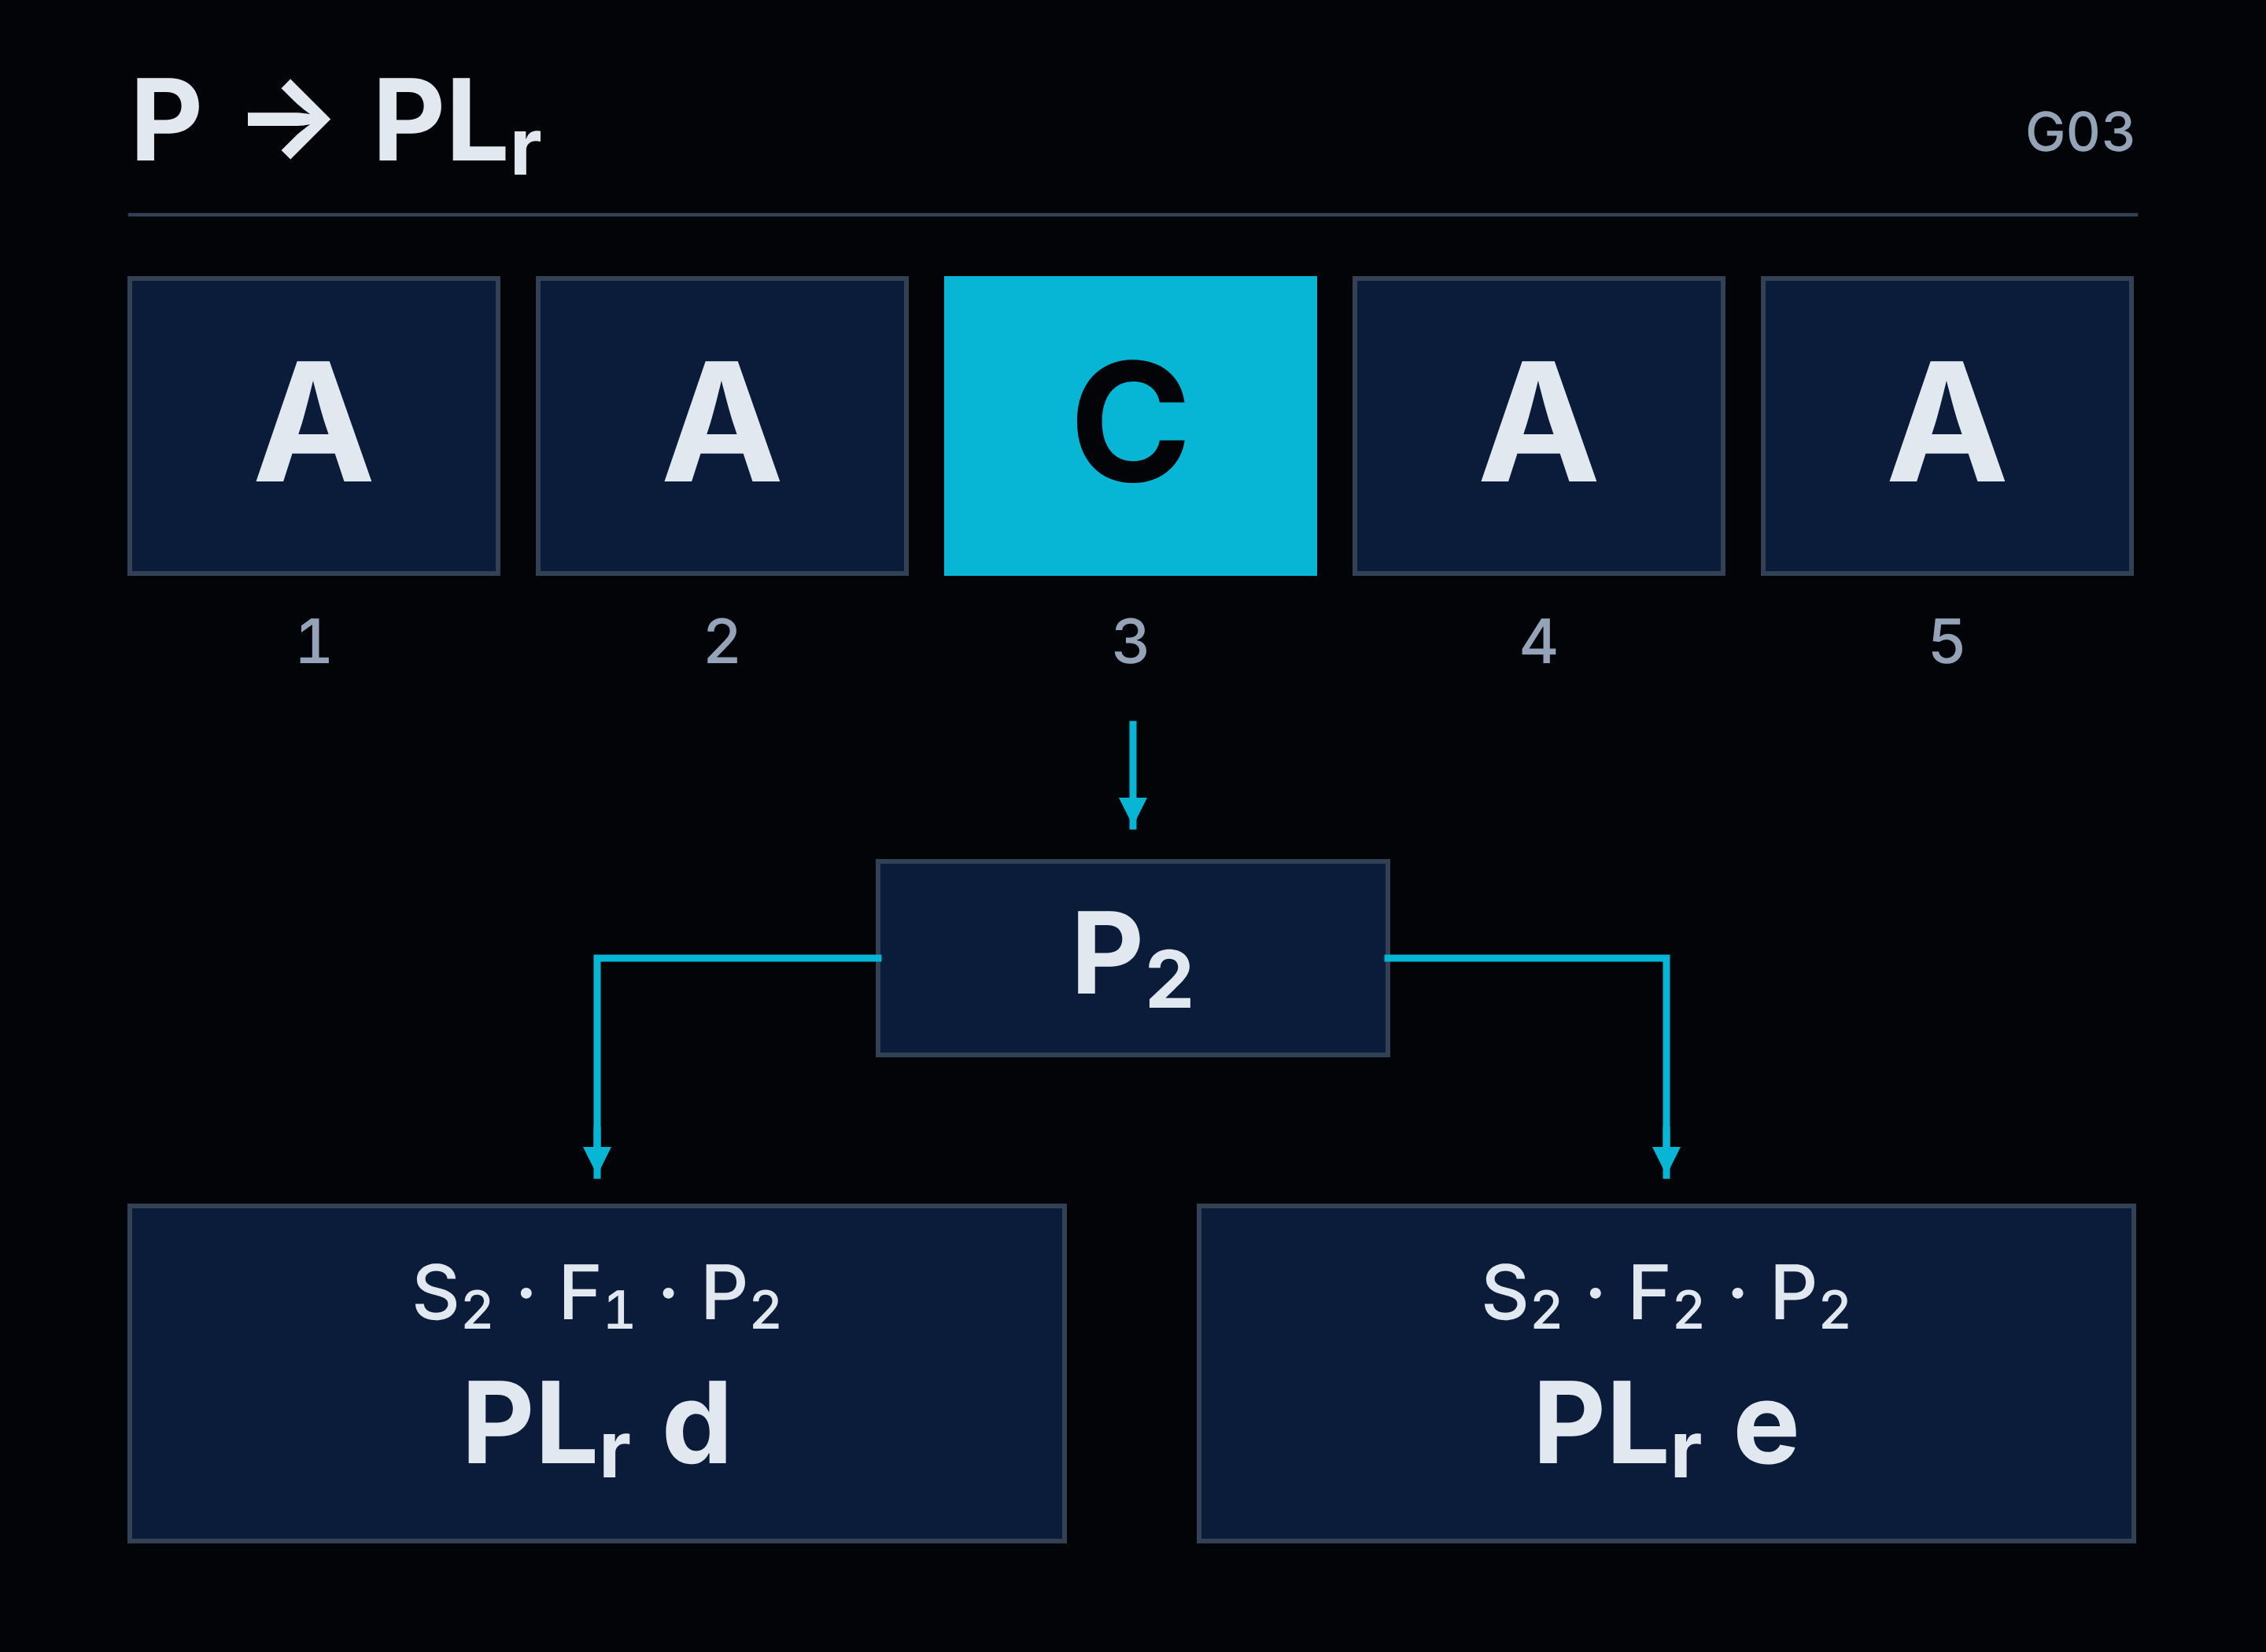
In the risk graph used to determine PLr, we consider the severity of the possible injury, the frequency or duration of exposure, and the possibility of avoiding or limiting the harm. These correspond to parameters S, F, and P.
S2 covers serious, usually irreversible injury or death. A finger amputation therefore does not become S1 merely because the person survives. A catastrophe affecting half the production hall does not need to be considered for the function to have a high requirement.
For S2, the basic risk graph gives the following results:
| Severity of injury | Exposure | Possibility of avoiding or limiting harm | Basic risk graph result |
|---|---|---|---|
| S2 | F1 — less frequent and/or brief | P1 — possible under specific conditions | PLr c |
| S2 | F1 — less frequent and/or brief | P2 — scarcely possible | PLr d |
| S2 | F2 — frequent or prolonged | P1 — possible under specific conditions | PLr d |
| S2 | F2 — frequent or prolonged | P2 — scarcely possible | PLr e |
For S2, even favorable F1 and P1 ratings result in PLr c in this risk graph. One less favorable rating—F2 or P2—is enough to result in d. Both together result in e.
These levels are not selected according to how impressive the machine looks. Even a small mechanism can cause an irreversible injury.
“The operator is experienced.” But there is nowhere to retreat
Assume that an intended operating task requires a person to stand between a moving element and a fixed structure. The unexpected movement under consideration could cause severe crushing. The safety function is intended to prevent this movement during access.
When assessing the possibility of avoiding harm, the following argument is made: the operator knows the machine, has been trained, and has performed this task for years. The proposed rating is P1.
However, in the position required to perform the task, there is physically no room to retreat from the path of movement.
The worker’s experience is relevant. It does not change the geometry of the workstation.
A trained operator was entered in the assessment. Apparently, the operator was expected to provide the missing escape space personally.
One method for determining P considers five factors: the person’s preparedness, the speed at which the event develops and the available time, the physical possibility of retreating, the ability to recognize the hazard, and the complexity of the task. Ratings of A, B, or C are assigned according to the conditions associated with each factor.
In this method, one C is enough to assign P2, even if all the other ratings are A.
The lack of physical escape space is precisely such a C. The lack of time for an effective retreat may also be a C. These constraints are not averaged against favorable ratings for the other factors. Four favorable answers do not create a passage through a steel structure.
For the S2 under consideration, this means PLr d for F1 or PLr e for F2.
Nor do we automatically select P1 when there are no C ratings. The remaining factors and the actual possibility of avoiding or significantly limiting harm must be assessed. The table structures the assessment. It does not remove the need to understand the situation being described.
Machine limits affect the control system requirement
The possibility of retreating must be checked under the conditions of intended use. It must not be checked only with an empty workstation, no material present, and convenient access from all sides.
If a person has free space when the smallest workpiece is present, but the largest permitted workpiece occupies that space, the latter scenario must be considered. The same applies to pallet positions, tooling, and tasks that require a person to occupy a specific position.
The intended use, workpiece dimensions, and task location are not merely a descriptive introduction to the “actual calculations.” They may determine the requirement that those calculations must satisfy.
F is assessed in the same way. A brief task repeated every few minutes does not become infrequent simply because each individual access lasts only a moment. Both the frequency and the total duration of exposure must be considered.
Under the approach described, and without other justification, a frequency of more than once every 15 minutes results in F2. The guidance for assigning F1 combines two conditions: a frequency of no more than once every 15 minutes and a total exposure duration not exceeding one twentieth of the operating time.
It also does not matter whether successive access operations are performed by the same worker or by several people.
Changing the operator does not reset the frequency of exposure at the machine.
Do not lower the requirement based on the effectiveness of the function you are assessing
“The risk is low because the drive stops when the guard is opened.”
If we are determining the required PLr of the function that stops the drive when the guard is opened, this justification is incorrect. The answer already assumes the effective operation of the function for which the requirement is only now being determined.
When determining PLr, we consider the situation without taking into account the risk reduction provided by the assessed function itself. This does not mean disregarding all other safeguards. Appropriate technical protective measures independent of the control system and additional safety functions may be taken into account. However, their effect must be distinguished from the effect of the function whose required level is being determined.
You cannot first credit the function’s effectiveness and then use that credited effectiveness to derive a less stringent requirement for the function itself.
A lower result may be justified. Purchasing a relay is not a justification
The risk graph is not the only permitted method for determining PLr. It is informative. The applicable type-C standard for a specific type of machine may specify the required level differently from the general risk graph.
In the approach described above, the result can also be reduced by one level if the probability of occurrence of a hazardous event has been assessed as low. This decision must be justified and documented. It is not enough to add “unlikely” after finding that the achieved PL is too low.
It must be possible to indicate which event was assessed, what limits the possibility of its occurrence, and on what basis the probability was considered low. Merely stating that “there has not been an accident for years” does not yet answer these questions.
Ultimately, we compare two independently determined values: the required PLr and the achieved PL. If an actual change to the design or method of use reduces the risk, the requirement can be reassessed. If only an answer in the form has been changed, the machine has not thereby become less hazardous.
The graph is not intended to justify a relay that has already been ordered. It is intended to help determine what the person who will work at this machine needs.
4. When can the simplified method be used, and when are more detailed calculations required?
“The result is d? Then let us try the simplified method.”
The hardware remains the same. So does the wiring. No one improves the diagnostics or replaces a subsystem. Only the method used to obtain the result changes, until e appears in the appropriate field.
A very efficient retrofit. There is not even any need to open the control cabinet.
The problem is not the use of simplifications. The standard provides for them, and under the appropriate conditions they allow the system to be assessed correctly without building a mathematical model from scratch. The problem arises when the method is selected only after checking which one produces the more convenient result.
The system being assessed and the available data determine the choice of method. The acceptance deadline is not an additional calculation parameter.
First determine what you are actually assessing
The term “simplified calculations” can easily conflate two different activities.
The first is the assessment of a subsystem built from components. For example, the parameters of a custom output subsystem consisting of contactors and the diagnostics implemented for them must be determined. The component data are known, but the result for their combined operation still has to be determined.
The second is the assessment of a combination of subsystems that already have defined safety parameters. In this case, we use the assessment performed previously, verify the conditions of use, and determine the result for the combination.
There is no need to break down an assessed relay into its internal components simply because it is being used in a custom machine. However, an independently assembled part of a circuit cannot be treated as a ready-made PL e subsystem merely because it contains two contactors and someone has drawn a box around it.
A box on the schematic helps organize the model. It does not assign safety parameters.
In practice, the distinction is as follows:
| What are we assessing, and what data do we have? | Appropriate approach |
|---|---|
| A series connection of previously assessed subsystems; all PFH values are known. | We add the PFH values and also account for the limitation imposed by the subsystem with the lowest PL. |
| Such a connection of subsystems; their PL values are known, but not all PFH values are known. | We can use the tabular method provided for this situation. |
| A custom subsystem corresponding to an architecture covered by the simplified method. | We determine the category, the MTTFD of the channels, and DCavg, provide the required measures against CCF, and satisfy the remaining assumptions. |
| A custom subsystem whose architecture does not correspond to the architectures covered by this method. | We need a substantiated model and a detailed calculation that demonstrates achievement of the required level. |
Both approaches can be combined within a single function: ready-made data for assessed subsystems can be used, while the part designed by the integrator can be assessed independently. There is no need to choose between “copying everything from catalogs” and “calculating everything from the individual transistor.”
The table gives e. The available data give d
Let us return to the three subsystems from the first part:
PFH=(3+4+5)×10−8=1,2×10⁻⁷ h−1.
Each subsystem was assessed as PL e. However, the sum of the PFH values falls within the range for d.
The standard also includes a method for combining subsystems when not all PFH values are known. This method uses the lowest PL and the number of subsystems at that level. When the lowest PL is e and there are no more than three such subsystems, the table indicates e.
We therefore have a specific discrepancy: the letter ratings alone can produce e, even though the sum of the known values in our example gives d.
This should not be concealed behind an assurance that every simplified method always produces a more conservative result. In this comparison, that is not the case. Instead, the condition for which the method is intended must be considered.
If the PFH values of all subsystems are known, they must be added. The table for unknown PFH values is not a second attempt after failing the addition.
Manufacturer data do not become unknown merely because they no longer support the expected result.
Using the table within its proper scope is not an error. The error would be to knowingly reject available values solely to replace an inconvenient d with a more favorable e. This does not reduce the system’s frequency of dangerous failures. The documentation author has simply stopped accounting for it at the level of precision supported by the data.
The simplified method reduces the calculation effort, not the need to verify the assumptions
When assessing a custom subsystem, the simplification works differently. We use the results of models developed for specified architectures instead of developing all the mathematical relationships from scratch.
The chart combining category, MTTFD, and DCavg is not an illustrative diagram from which to select the bar that most closely matches one’s expectations. It presents the results of mathematical models for specified structures and conditions.
First, therefore, we need to determine whether our subsystem actually conforms to them. How will it behave when a fault occurs? Which failures will be detected? What are the channel parameters? Have the required measures against common cause failures been implemented?
The easiest approach is to select the category and diagnostic coverage so that the bar reaches e. Unfortunately, we would then still have to build a system that corresponds to those selections.
The method is also based on assumptions concerning the mission time and the frequency of failures during that period. It does not automatically provide a twenty-year life for every component entered into the calculation. Components subject to wear may require earlier replacement. We will return to this when discussing the number of cycles.
Similarly, obtaining a more precise numerical reading instead of reading a value from a graph does not change the type of model used. We may obtain a more precise PFH value, but we must still satisfy the conditions of the method from which it was obtained.
A result expressed with more digits does not describe a machine more accurately if its model omits a significant dependency. It describes the omission more accurately.
When is a detailed calculation required?
The dividing line is not between a small and a large control cabinet. More devices do not automatically mean that a custom model must be built. Fewer components do not guarantee that the simplest variant may be used.
What matters is whether the subsystem can be correctly represented by the architecture for which the simplified method was developed.
The electrical schematic does not have to look identical to the block diagram in the standard. These are different ways of representing the system. However, the equivalence of the relevant dependencies must be demonstrated: the implementation of the subfunctions, redundancy, diagnostics, and behavior under fault conditions.
If there is no such equivalence, a detailed calculation based on an appropriate model is required, for example Markov modeling or fault tree analysis. The model must account for the characteristics of the solution that fall outside the adopted simplification.
A schematic can be redrawn to make it look familiar. A common point of failure, however, is not eliminated by separating two lines on a screen.
A detailed calculation also does not permit qualitative requirements to be disregarded. If we claim a specific category, its requirements must be met. If a function is intended to respond in a specific way, that response must be ensured. More advanced mathematics does not replace missing diagnostics or justify incorrect logic.
The point is not to have every designer perform Markov modeling. The point is to recognize when the ready-made model no longer represents the actual system. At that point, either the design must be changed so that it can be correctly assessed using the simplified method, or an appropriate detailed analysis must be performed.
“We do not have MTTFD” is not yet a choice of method
The standard also provides a limited alternative procedure for subsystems incorporating certain mechanical and fluid power technologies, including electrohydraulic and electropneumatic technologies, when reliability data are unavailable and the specified good engineering practice method cannot be applied.
This is a specific route with its own conditions concerning, among other things, architecture, diagnostics, components, and mission time. It is not blanket permission to assess any system without MTTFD.
“We did not find the data” describes the outcome of our search. It does not prove that we have met the conditions of the exception.
Before approving the result, it must therefore be possible to explain what was assessed, which data were used, why the selected method is applicable, and where compliance with its assumptions was demonstrated.
This is far more important than the length of the report. A few transparent calculations for a correctly defined system are more valuable than dozens of pages of printouts that their author cannot relate to the schematic.
If changing the method increased the result from d to e while nothing in the machine was changed, the first question should be: what are we now calculating differently, and why are we allowed to do so? Not: where do we sign the acceptance.
5. DC 99% and CCF passed. What was actually implemented?
A high diagnostic coverage was entered in the calculations. The measures against common cause failures were also marked as passed. The result looks good.
Now those protective measures must be found in the machine.
A value selected from a drop-down list has one advantage over actual diagnostics: it can always be set to 99%.
The calculation alone does not determine whether the system actually detects the assumed failures. It processes the data supplied to it. If the diagnostics were assessed based on wishful thinking, the result may be mathematically correct and technically worthless.
The feedback line is present. What actually comes back?
Let us return to the two contactors K₁ and K₂. The design provides for monitoring their states, and DC = 99% was assumed for the calculations.
Assume that the main contacts of K₁ remain closed despite the switch-off command. K₂ can still interrupt the power circuit. However, the diagnostics must detect the incorrect state of K₁, and the system must respond appropriately.
So what does the feedback signal actually verify?
If it only confirms that the program deactivated the command to energize the coil, it provides no information about whether the main contacts actually opened. We know what the controller requested. We do not yet know whether the contactor performed the requested action.
The controller issued a command and verified its own command. The contactor did not have to participate in this check.
Connecting just any auxiliary contact does not resolve the issue either. There must be a suitable, verified relationship between its state and the elements whose failure is to be detected. Correct wiring, an assessment of possible faults in the feedback circuit, and logic that uses the information at the correct time are also required.
The standard specifies high diagnostic coverage for certain methods of directly monitoring electromechanical devices. It does not grant high diagnostic coverage merely because a terminal labeled “feedback” is present.
First, it must be demonstrated what the implemented solution detects. Only then may the corresponding value be entered.
DC is not the percentage of successful stop attempts
DC is the ratio of the rate of detected dangerous failures to the rate of all dangerous failures of the component under consideration. It does not mean the percentage of successful stops or the number of failure modes checked off a list.
One hundred correct stops by a functioning system do not confirm that it detects 99% of dangerous failures. None of the failures credited as detected in the calculation may have occurred during these tests.
It was verified that a functioning contactor opens. The report concluded that the system would detect a contactor that failed to open. The verification needed to connect these statements is missing.
This does not mean that one hundred devices must be damaged to calculate the percentage. Diagnostic coverage can be justified through failure analysis or the appropriate use of estimates provided in the standard. However, it must be demonstrated that the described measure corresponds to the actual implementation.
DC = 99% for a monitored contactor also does not automatically mean DCavg = 99% for the entire subsystem. The other components have their own failures and their own diagnostics. When determining average diagnostic coverage, their contribution to the dangerous failure rate is taken into account. A component without failure detection does not disappear from the calculation merely because it lowers the average.
Excellent monitoring of one component does not extend to the others merely because they are adjacent in the control cabinet.
A failure has been detected. Can production continue?
The detection of an abnormal condition must also be linked to a response.
In our variant, the failed K₁ remains closed. The system detects the discrepancy and inhibits restart because continued operation does not comply with the adopted protective strategy.
At start-up, however, a problem arises: the message stops production. Someone changes the condition so that operation can continue after the alarm is acknowledged. The diagnostics still have the same value in the calculations.
Detection was retained. Only its inconvenient consequence was removed.
Not every response to a failure has to be identical. It must, however, comply with the requirements of the function and the adopted architecture. If the justification accounted for failure detection and the prevention of hazardous continued operation, merely displaying a message on the panel is not an equivalent solution.
The entire sequence must be checked: the failure, its detection, the timing of detection, and the machine response. Not merely whether an input state changes in the controller.
Two channels can share a single cause of failure
Redundancy is effective when the failure of one channel does not compromise the effectiveness of the other. It is therefore not enough to draw two channels and continue treating them as independent without analysing their operating conditions.
Consider a foreseeable power-supply surge that could damage components in both channels. Or a temperature increase following a cooling failure, affecting both channels simultaneously. This is exactly the type of issue that must be considered when assessing CCF—common cause failures.
A surge does not stop after damaging the first channel just to respect the redundancy shown in the schematic.
A common power supply or common enclosure does not automatically mean that the solution is unacceptable. However, adequate immunity and the protective measures applied must be demonstrated. It must not be assumed that every abnormal condition will politely remain confined to one channel.
Measures against CCF must therefore be assessed for the actual subsystem and its application. Protecting the inputs, logic, and outputs may require different solutions. A single table copied between projects does not confirm that the same assumptions are valid for each of them.
Five points are missing. But training was provided
The scoring method described in the standard requires at least 65 points for the measures applied against CCF. This is not a percentage of detected failures or a quality rating for the entire machine.
Suppose the justified items total 60 points. Five are missing. The table includes an item on training, and the documentation contains an attendance list from operator training.
It can be checked off. The spreadsheet will accept it.
However, the assessed measure concerns training designers in the causes and effects of common cause failures, with appropriate documentation. Training operators in machine operation answers a different question.
Employees were taught how to operate the machine. The calculation credited the designer with knowing the causes of common cause failures. Five points were obtained by changing the training audience.
The same applies when points are added for a measure that has only been partially implemented. Under this method, partial compliance does not earn partial points. It earns zero points for that item.
This is not about being meticulous for the sake of the table. The scoring method replaces a more detailed assessment only if its rules are followed. If points start being awarded for solutions that are similar, planned, or “normally used,” the method is no longer being applied, even though the form still looks the same.
A parameter must correspond to a specific solution
For the adopted DC, it should be possible to identify the monitored component, the method used to detect its dangerous failures, and the required response. For credited measures against CCF, it should be possible to identify the actual implementation, the conditions of application, and the basis for awarding the points.
For a previously assessed subsystem, the relevant data and integration conditions are used. A separate assessment must be performed for the part of the system developed in-house. The internal diagnostic coverage of a relay must not be transferred to contactors, sensors, and connections that are not covered by that parameter.
After modifying the software, devices, or connections, it must also be checked whether the previous justification still corresponds to the machine. Removing monitoring or weakening the response to a failure remains significant even if no one has opened the calculation file.
DC and CCF must describe the safeguards that were implemented. Not those that were missing to achieve the required letter.
6. One Thousand Cycles per Shift. The Safety Relay Is Working Too
A semi-automatic assembly station. The operator opens the guard, replaces the workpiece, closes the guard, and starts the next cycle. In the solution under consideration, each opening de-energizes the relay outputs and contactors, while restoring readiness energizes them again.
One thousand times per shift.
Yet, to assess service life, someone considers only the occasional use of the emergency stop. After all, the same contactors are also used in the E-STOP function, and hardly anyone ever presses the mushroom pushbutton.
In the calculations, the equipment waits for an emergency. In the control cabinet, it handles every successive workpiece from the start of the day.
It is possible to copy the manufacturer’s data correctly, apply the formula correctly, and obtain a completely useless result. All it takes is to calculate for a different number of operations than the component actually performs.
A Safety Function Does Not Have to Wait for an Emergency
Safeguarding may be involved in normal machine operation throughout the entire shift. This does not mean that an emergency occurs every half minute. It means that the operating method requires a specific safeguarding task to be performed regularly.
At a station where the guard is opened for every workpiece, that task is to prevent hazardous motion during access. For manual loading through a light curtain field, it is to stop the motion or keep it inhibited after the field is interrupted. With correctly implemented two-hand control, it is to enable a specific hazardous motion only when the required control conditions are met.
In each of these implementations, relay outputs may operate during every machine cycle. They may—but do not have to. The specific circuit must be checked. One thousand interruptions of the light curtain field do not automatically mean one thousand switching operations by every device in the control cabinet.
Likewise, executing a program block during every PLC scan is not a mechanical cycle of a relay.
The word “safety” describes the intended purpose of the device. It does not exempt its contacts from the laws of physics.
One Machine, Three Different Things to Calculate
During design, we need to distinguish between human exposure, demand on the safety function, and operations of a specific component.
For exposure, we are interested in how often and for how long a person is in the situation under consideration relative to the hazard. For demand on the safety function, we consider when its task must be performed. For contactor service life, we consider how many cycles that specific contactor performs.
These figures may be related. However, they are not identical by definition.
Assume that K₁ is involved in emergency stopping, access protection provided by a guard, and normal process stopping. Its number of operations includes the actual switching operations resulting from all these applications, not just the function for which we happen to have opened the calculation worksheet.
On the other hand, we do not count the same physical cycle three times merely because it has been assigned to three functions. We count the work performed by the component, not the number of places where its designation appears.
Separating functions in the documentation is necessary. It does not divide the wear of a shared device into several independent limits.
A contactor does not receive a new set of contacts when we move to the next section of the report.
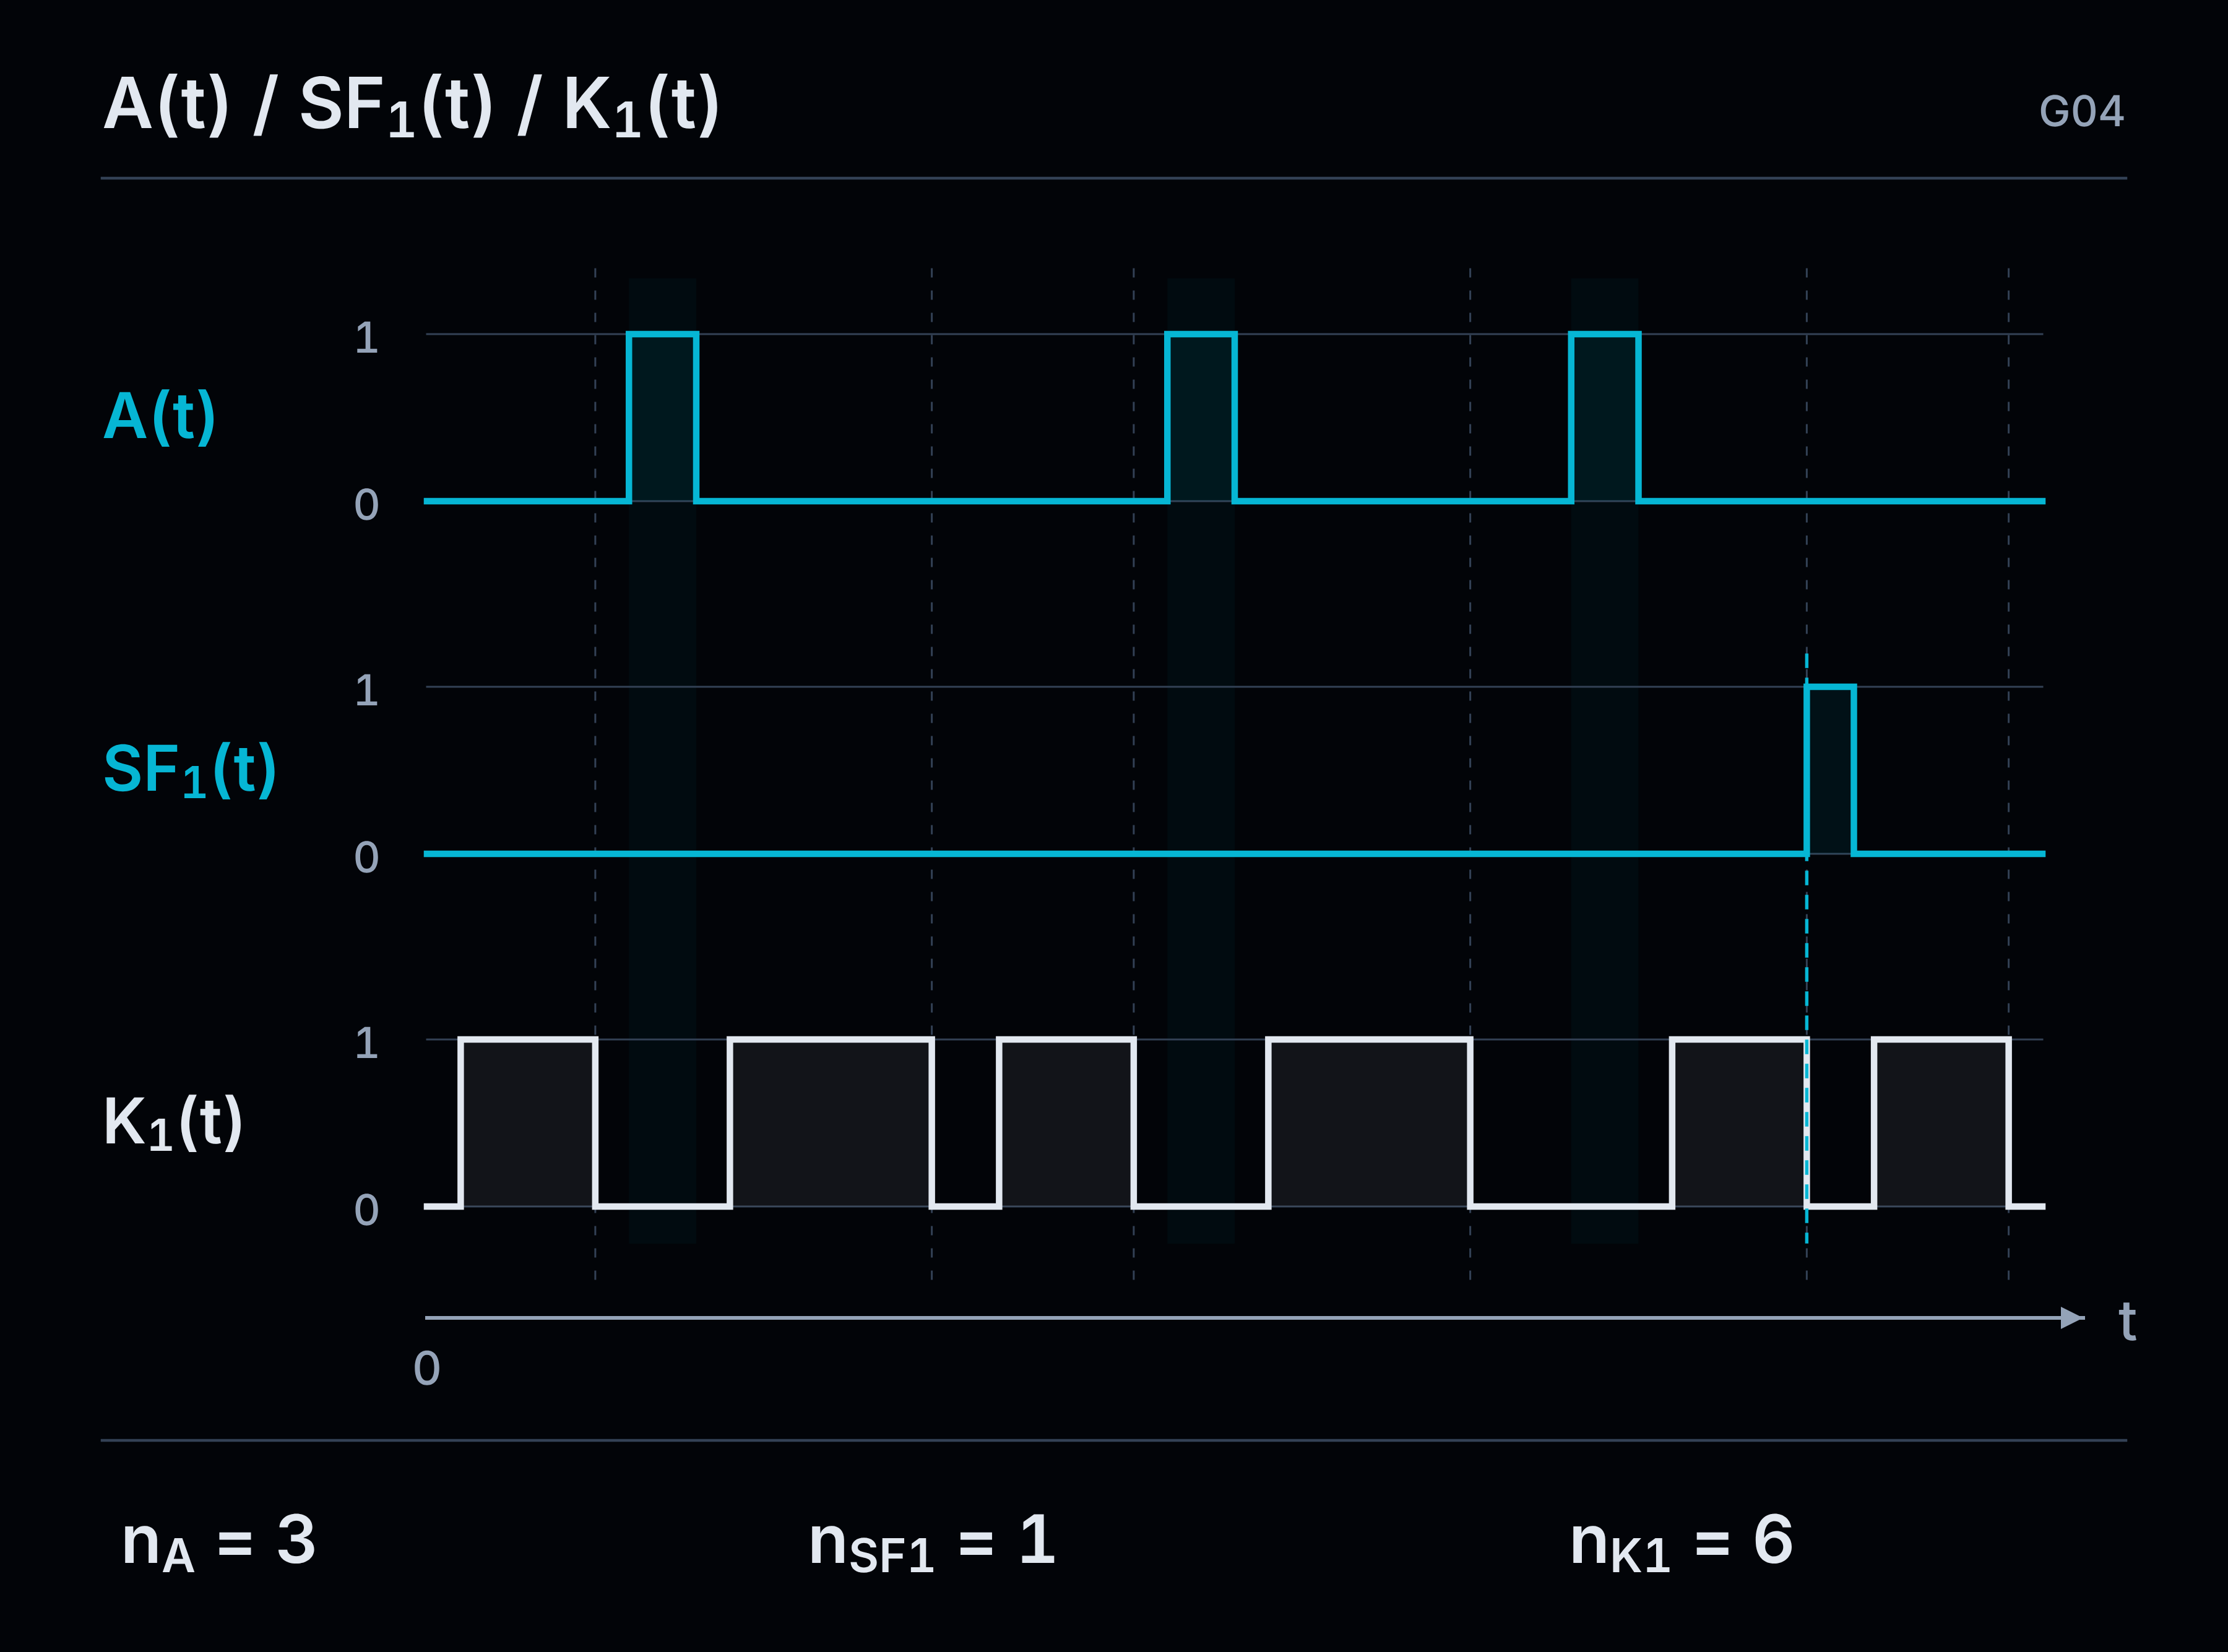
Half a Million Cycles per Year. Without an Exceptionally High Production Rate
For our example, assume 1000 complete component cycles per shift, two shifts per day, and 250 working days per year.
The annual number of operations is:
nop=1000×2×250=500 000 cycles/year.
One thousand cycles during an eight-hour shift gives an average of one cycle every 28.8 seconds. We do not need a line producing hundreds of units per minute for the equipment to perform hundreds of thousands of operations per year.
In this example, one complete cycle includes energizing and de-energizing the component. In the actual selection process, the counting method must correspond to the cycle definition used for the relevant manufacturer’s data. The number of energizations from one data set and the number of state changes from another must not be treated as the same quantity.
Additional operations during planned tests, adjustments, or other activities must also be included—if they actually cause this component to switch.
An annual production plan can be specified down to the individual unit. The number of switching operations used in safety calculations should not come from a less precise conversation.
B10D Is Not a Guarantee of Operation up to the Millionth Cycle
For electromechanical, mechanical, and pneumatic components subject to wear, we can use the B10D parameter. It describes the mean number of cycles until 10% of the components have failed dangerously.
It does not mean that every unit will safely complete this number of operations. Nor is it just any “service life” value taken from a catalog.
The data must correspond to the application and operating conditions. For contacts, one relevant factor is the load for which the value was specified. Mechanical service life, electrical service life, and B10D do not become interchangeable simply because they are all stated in cycles.
The largest number in the catalog gives the most attractive result. It is still worth checking whether it applies to the conditions in our machine.
For the following calculation, let us assume a model value of B10D = 1 000 000 cycles for a single electromechanical component that meets the conditions for applying this method. This is an assumption for the example, not a parameter of a specific product.
MTTFD: twenty years. Replacement: no later than after two
Using B10D and the annual number of operations, we determine the component's MTTFD:
MTTFD = B10D / (0,1 × nop).
For our data:
MTTFD = 1 000 000 / (0,1 × 500 000) = 20 years.
That may seem reassuring. The machine is intended to be used for ten years, so twenty looks like a substantial margin.
Except that MTTFD is not the permissible service life of this particular unit.
Using the same method, we determine T10D, which limits the component's service life:
T10D = B10D / nop = 1 000 000 / 500 000 = 2 years.
Both results are correct. MTTFD describes the component's reliability within the adopted model. T10D specifies the limit on its service life resulting from B10D and the operating frequency.
Anyone who treated twenty years as the replacement interval has just extended operation tenfold. Solely by confusing the names of two parameters.
If the intended service life of the system is longer, the component must be replaced no later than when T10D is reached. This is not a prediction that the device will stop working on that exact day. It is the limit within which the adopted reliability justification applies.
These two calculations have not yet given us PL e or any other PL for the entire function. They have given us the reliability parameter of a single component and a limit on its service life. Both pieces of information must be incorporated into the appropriate subsystem assessment.
Simply promising replacement every two years does not automatically improve MTTFD from 20 to 100 years. Nor does it remedy missing diagnostics. It makes it possible to comply with the limit on which the applied method is based.
An off-the-shelf safety relay is not a single contact
The calculation above concerned a component assessed using the B10D method. For an off-the-shelf, previously assessed safety module, we use the parameters and conditions applicable to that module and its application.
If PL and PFH are specified, it is necessary to check the configurations, loads, operating frequencies and service life for which these data apply. If a cycle limit is specified, it must not be ignored merely because PL e appears next to it.
We do not take an arbitrary figure described as the relay's endurance, independently label it B10D, and use it to declare a new result for the entire module.
The project must incorporate not only the favourable letter from the product data sheet, but also the conditions stated beneath it.
If the actual operating frequency requires a specific component to be replaced every two years, while the machine is intended to operate for ten years, this creates a specific maintenance task. The subsequent replacements must be planned, and the user must be given the information needed to perform them. A result left solely in the designer's file does not organise inspections at the plant.
A machine may not require an emergency stop for years. During that time, the contactor intended to perform it may switch millions of times. The words “E-STOP” on the schematic do not subtract a single cycle.
7. A machine for ten years. The first relay for two
The design documentation specified periodic replacement of the component. The instruction manual retained only a general recommendation: “inspect the safety system regularly”.
After two years, the relay is still working during the inspection. The machine stops when the guard is opened. No fault has been reported, so no part is ordered.
The designer planned replacement before failure. The plant replaces the component after failure. The achieved PL was recorded as though both parties had agreed on the same method.
They had not. If periodic replacement was a condition adopted when assessing the function, it cannot be left solely in the calculations. The user must know which component to replace, when to replace it, and what to check after replacement.
The instruction to “inspect regularly” conveys none of this information. It does, however, make it possible to continue recording in inspection reports for years that the inspection was performed.
Five units. Four replacements. One machine
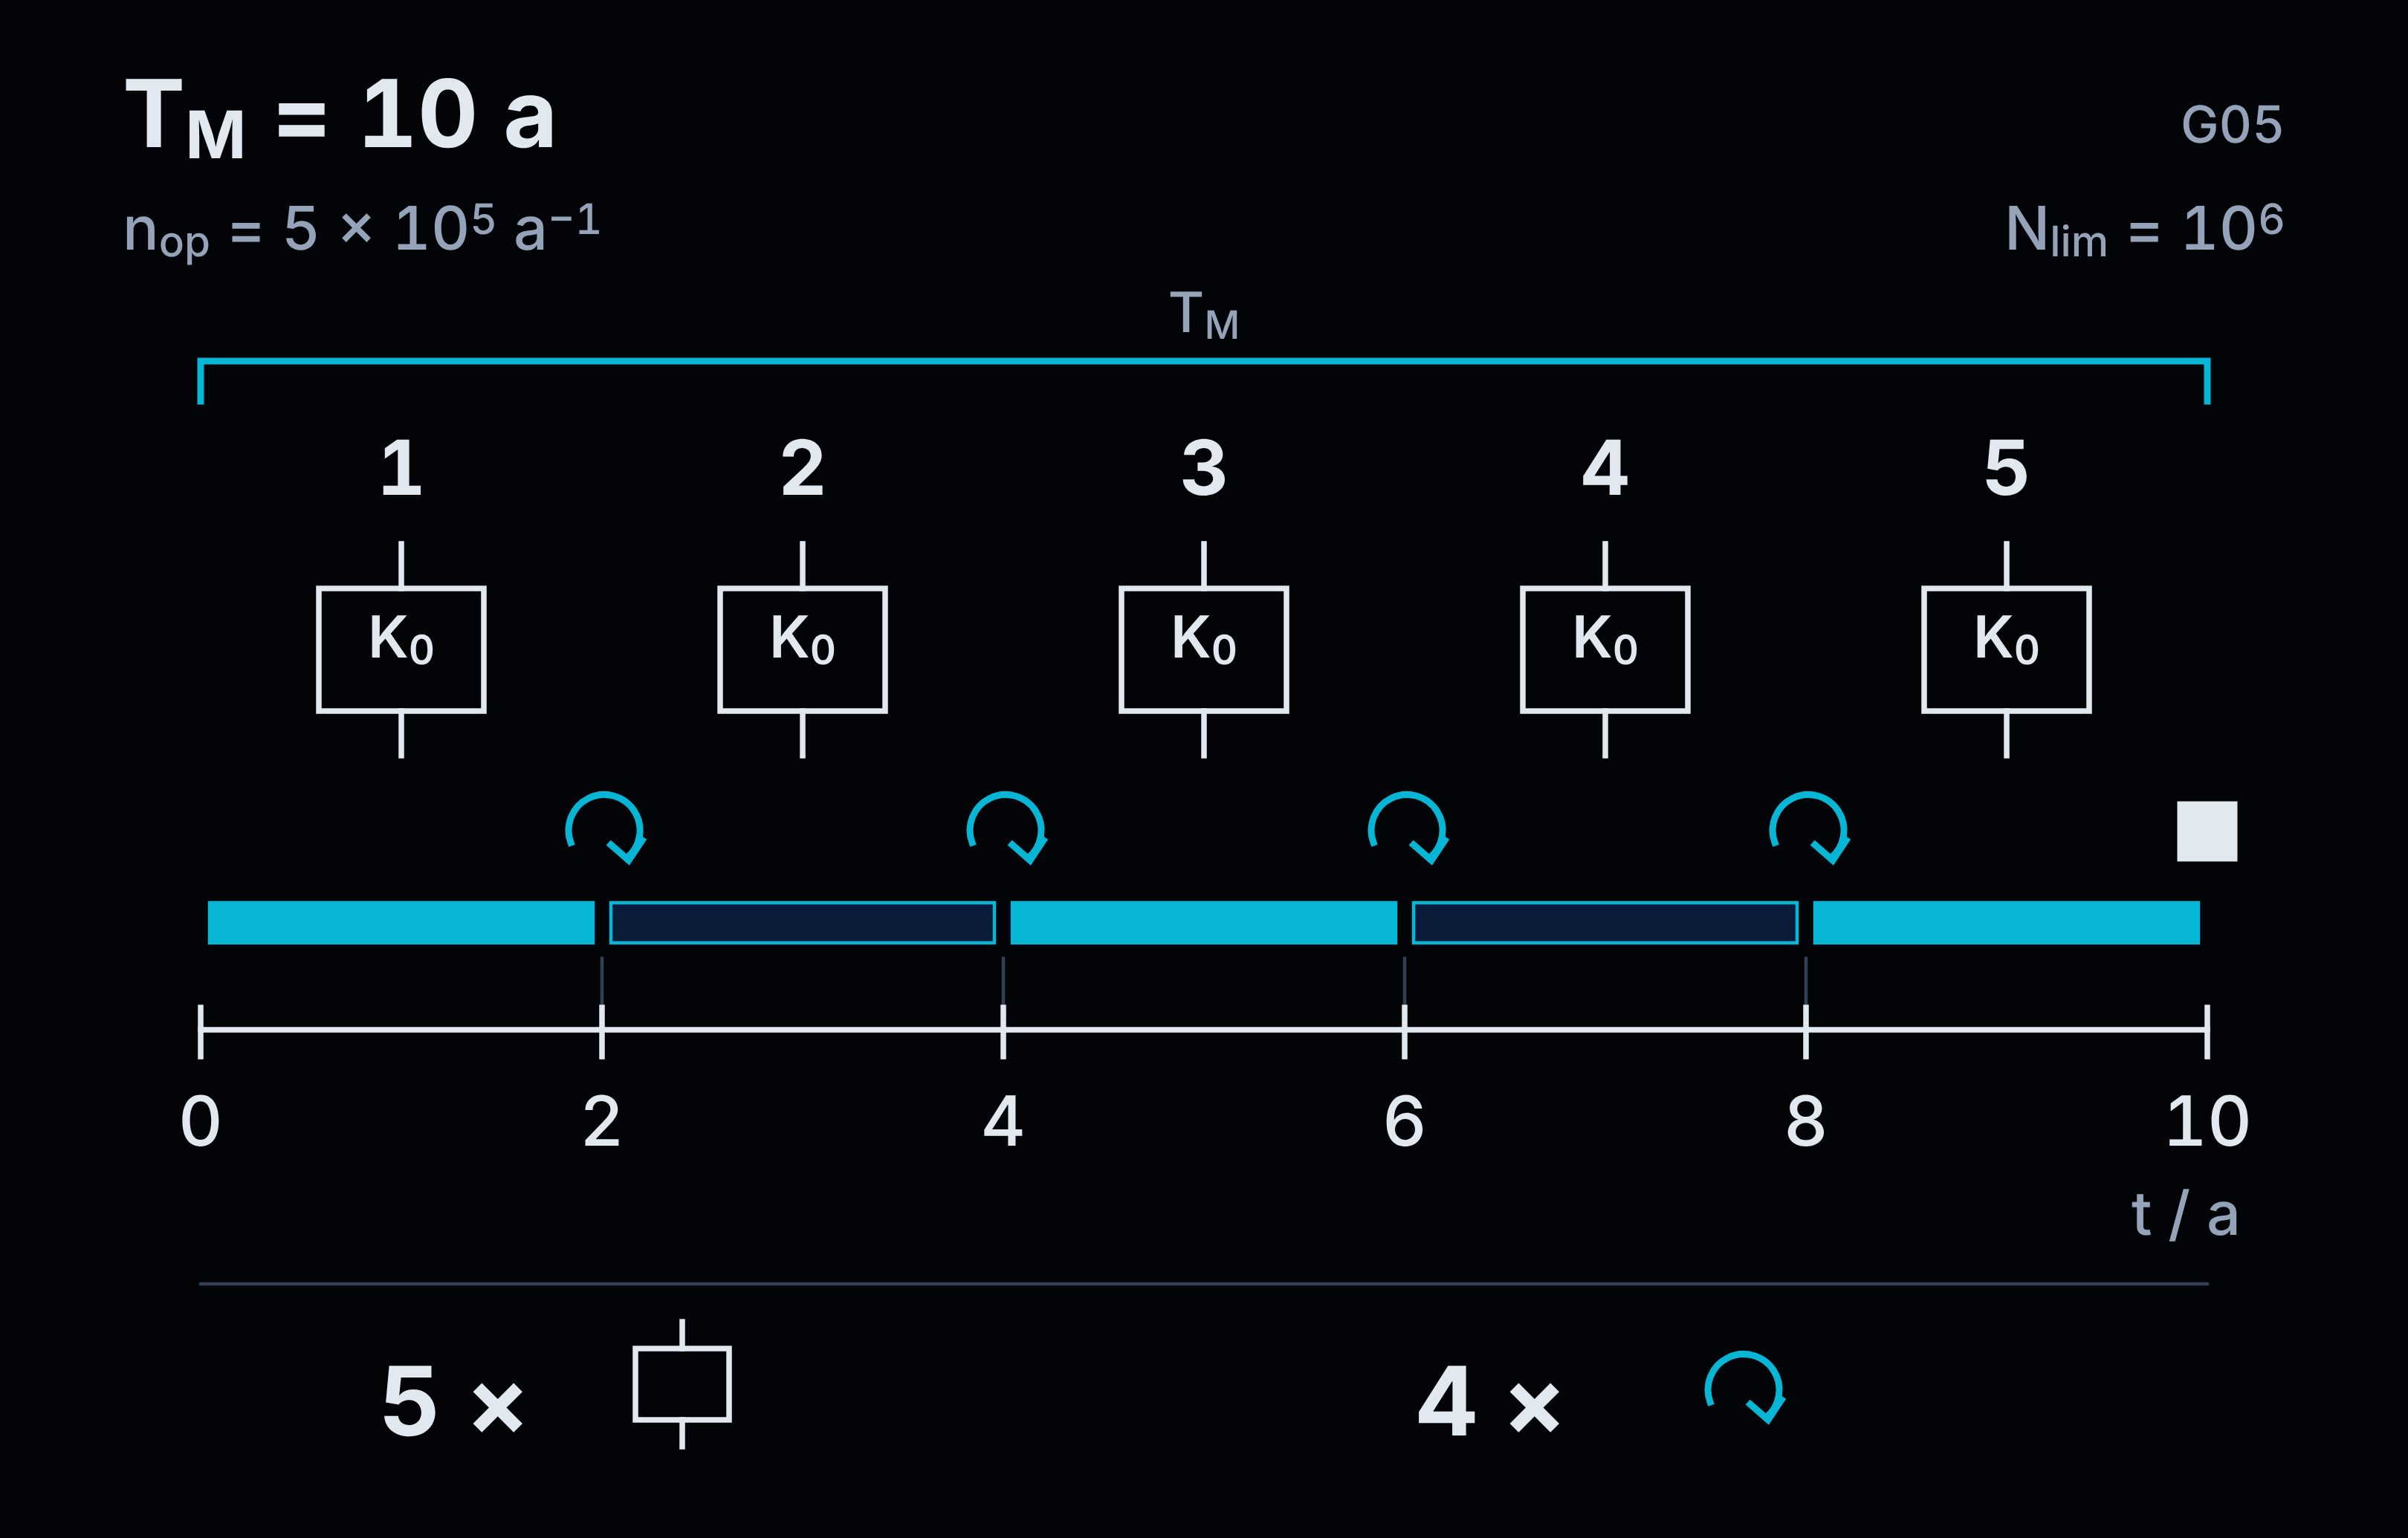
Consider an operating example: the machine is intended to be used for ten years, and a limit of one million cycles has been specified for the selected relay. At 500 000 cycles per year, this means replacement no later than after two years, unless another limitation requires earlier replacement.
This schedule does not determine the PL. It sets out the maintenance required to preserve the conditions under which the system was assessed.
With an unchanged operating frequency and replacements at the end of each successive two-year period, the schedule is as follows:
| Machine service period | Relay unit | Action at the end of the period |
|---|---|---|
| 0–2 years | First, installed during construction | First replacement |
| 2–4 years | Second | Second replacement |
| 4–6 years | Third | Third replacement |
| 6–8 years | Fourth | Fourth replacement |
| 8–10 years | Fifth | End of machine use in this scenario |
Five units and four replacements over ten years. Not five replacements—the fifth unit operates until the adopted end of service.
This is a limit schedule. In practice, replacement is planned so that the limit is not exceeded, rather than waiting until it has been reached before checking part availability and the next available shutdown window.
The delivery date of a new relay does not extend the permissible service life of the old one. Even if the supplier is very apologetic.
A machine’s service-life limit is not a date entered on the first page
Ten years of use must mean more than the expected payback period. The conditions under which the machine is to retain the required characteristics throughout this period must be specified.
How many shifts per day? How many days per year? How many operations? At what load? Which parts require replacement before the period specified for the machine as a whole expires?
“A machine for ten years” and “all parts for ten years” are two different promises. The second does not automatically come with the first.
The design documentation must include parameters and assumptions supporting the result. The information for use must include the resulting actions. The plant does not need to receive every internal design worksheet to know when to replace a relay. It must, however, receive unambiguous information that enables this replacement to be performed.
In practice, the instruction should lead to a specific designation on the schematic and a specific part. It should specify the limit, the method for determining the replacement date, the conditions for safely performing the work, and the required verification.
A cycle counter and an upcoming replacement warning can help with this. The schedule may also be time-based if the actual organization of use ensures compliance with the assumed operation limit. These assumptions must first be communicated, however.
Maintenance staff should not have to infer from the device’s production date what load the designer entered into the calculations three years earlier.
An additional production shift shortens the interval—not from tomorrow treated as day zero
Let us return to the component from the previous calculation. After one year of two-shift operation, it has completed 500 000 cycles. Half of the assumed one million.
The plant starts a third shift. With the same 1000 cycles per shift and 250 working days per year, the new operating intensity is:
1000×3×250=750 000 cycles/year.
The remaining 500 000 cycles will be used up after approximately eight months of such operation. Assuming uniform use, the limit will therefore be reached around the twentieth month after the start of operation, not after two years.
For a new unit, one million cycles would now correspond to approximately sixteen months. But a new unit was not installed in the control cabinet. The current one has already completed half a million operations.
A change in the production plan does not reset equipment wear. At most, the spreadsheet resets it if someone happens to start counting again from zero.
This requires revisiting more than just the replacement date. For the component from the earlier B10D example, increasing the number of operations from 500 000 to 750 000 per year changes the calculated MTTFD from 20 to approximately 13,3 years. This is new input for the subsystem assessment.
This does not automatically mean a one-letter reduction in PL. It means that it is necessary to verify whether the previous result remains justified at the changed operating intensity.
Earlier replacement resolves the problem of exceeding the limit. It does not replace verification of the other effects of the increased number of operations.
“We checked it. It still works” does not extend the assumed service life
A functional test and replacement after a specified time or number of cycles serve different purposes.
A successful test confirms operation within the tested scope. It does not restore the characteristics of a new unit to a worn component and does not, by itself, provide a basis for extending the limit assumed in the assessment.
The relay completed one more switching operation. Awarding it another two years for doing so would be an exceptionally generous interpretation of the test result.
This does not mean that the device immediately stops working once the replacement date has passed. Nor does it mean that PL e must automatically be changed to PL d. It means that continued operation can no longer be justified without modification by a result based on a condition that has not been met.
If the replacement was omitted, the required conditions must be restored and the system appropriately verified. Recording another successful inspection does not eliminate the overdue action.
The replacement part fits the socket. But does it fit the calculations?
At the next replacement, a different model is introduced. It fits mechanically, has the correct supply voltage, and has the same number of outputs. The machine can be started.
This does not yet confirm equivalence for the safety function.
Reliability parameters, response time, monitoring method, permissible load, and operating conditions may be relevant. The replacement part must meet the same safety requirements that are relevant to the application—not merely have matching dimensions.
The socket has verified the terminal spacing. The rest of the assessment still requires human judgment.
After repair or modification of the system, appropriate revalidation, including a functional test, is required. Its scope depends on the changes. Replacing a component with an identical one does not require treating the machine as a completely new design, but it does not remove the need to verify that the correct connections and operation have been restored.
A new relay also does not reset the history of the remaining parts. Contactors, sensors, and valves have their own limits. Replacing one device does not restart the service life of the entire system.
Maintenance must be designed, not merely recommended
If a component requires periodic replacement, it must be possible to perform that replacement. Access, part identification, space for tools, and the method of verification after the work are just as much part of the design as terminals and wiring.
An instruction to “replace every two years” is of little help if the device designation is not visible, removing it requires disconnecting adjacent circuits, and the documentation does not allow the connections to be restored without guesswork.
This does not justify postponing the replacement. It shows that the designer specified the required action but did not provide the conditions necessary to perform it.
The completeness of the operating instructions and replacement information is checked during validation. The absence of a replacement interval is therefore not a minor editorial oversight after the assessment has been completed. It may be a missing condition for maintaining the assessment result.
If the PL substantiation assumes four replacements but the instructions specify none, the user has been provided with operating conditions different from those for which safety was demonstrated.
8. PL calculated. Now the machine still needs to be checked
During acceptance testing, the guard was opened. A message indicating active STO appeared on the panel. The drive stopped producing torque, and the mechanism came to a halt shortly afterward. The test report stated: “the safety function works.”
“Shortly afterward” is a very convenient unit of time. Almost any stopping time can fit within it.
The calculation result meets the requirement and the equipment responds, but it is still necessary to determine whether the implemented response actually protects people. Was the correct motion stopped? Was it stopped quickly enough? Was the required state maintained after stopping? And was this verified under the conditions in which the machine will be used?
This is precisely why demonstrating PL ≥ PLr does not replace validation of the complete implementation of the function. Correctly calculating the reliability of a task that was incompletely specified is not enough.
STO is active. The motion has not yet stopped
STO—Safe Torque Off—is not a universal command to “make the machine safe.” It prevents the motor from producing torque. By itself, it does not perform a controlled stop, confirm standstill, or provide electrical isolation.
Consider a workstation with a rotary table. After STO is activated, the motor stops driving the table, but the stored kinetic energy does not disappear. The table stops only after coasting down. If a person can reach the hazardous motion during this time, the correct implementation of STO alone does not fulfil the protective task.
The inverter performed its function. The designer assigned it several additional functions that were never specified.
The need to stop a horizontal drive also differs from the need to hold a loaded vertical axis. If the load can move under the influence of gravity, it must be held safely. Switching off motor torque does not become a load-holding measure merely because it has been implemented with a high PL.
This is not an argument against STO. In a properly designed system, it can correctly perform the required subfunction. However, it is first necessary to determine whether the requirement is merely to prevent torque generation, to perform a controlled stop, to hold the load, or to combine several actions.
The price of an available drive function does not define the task that must be performed.
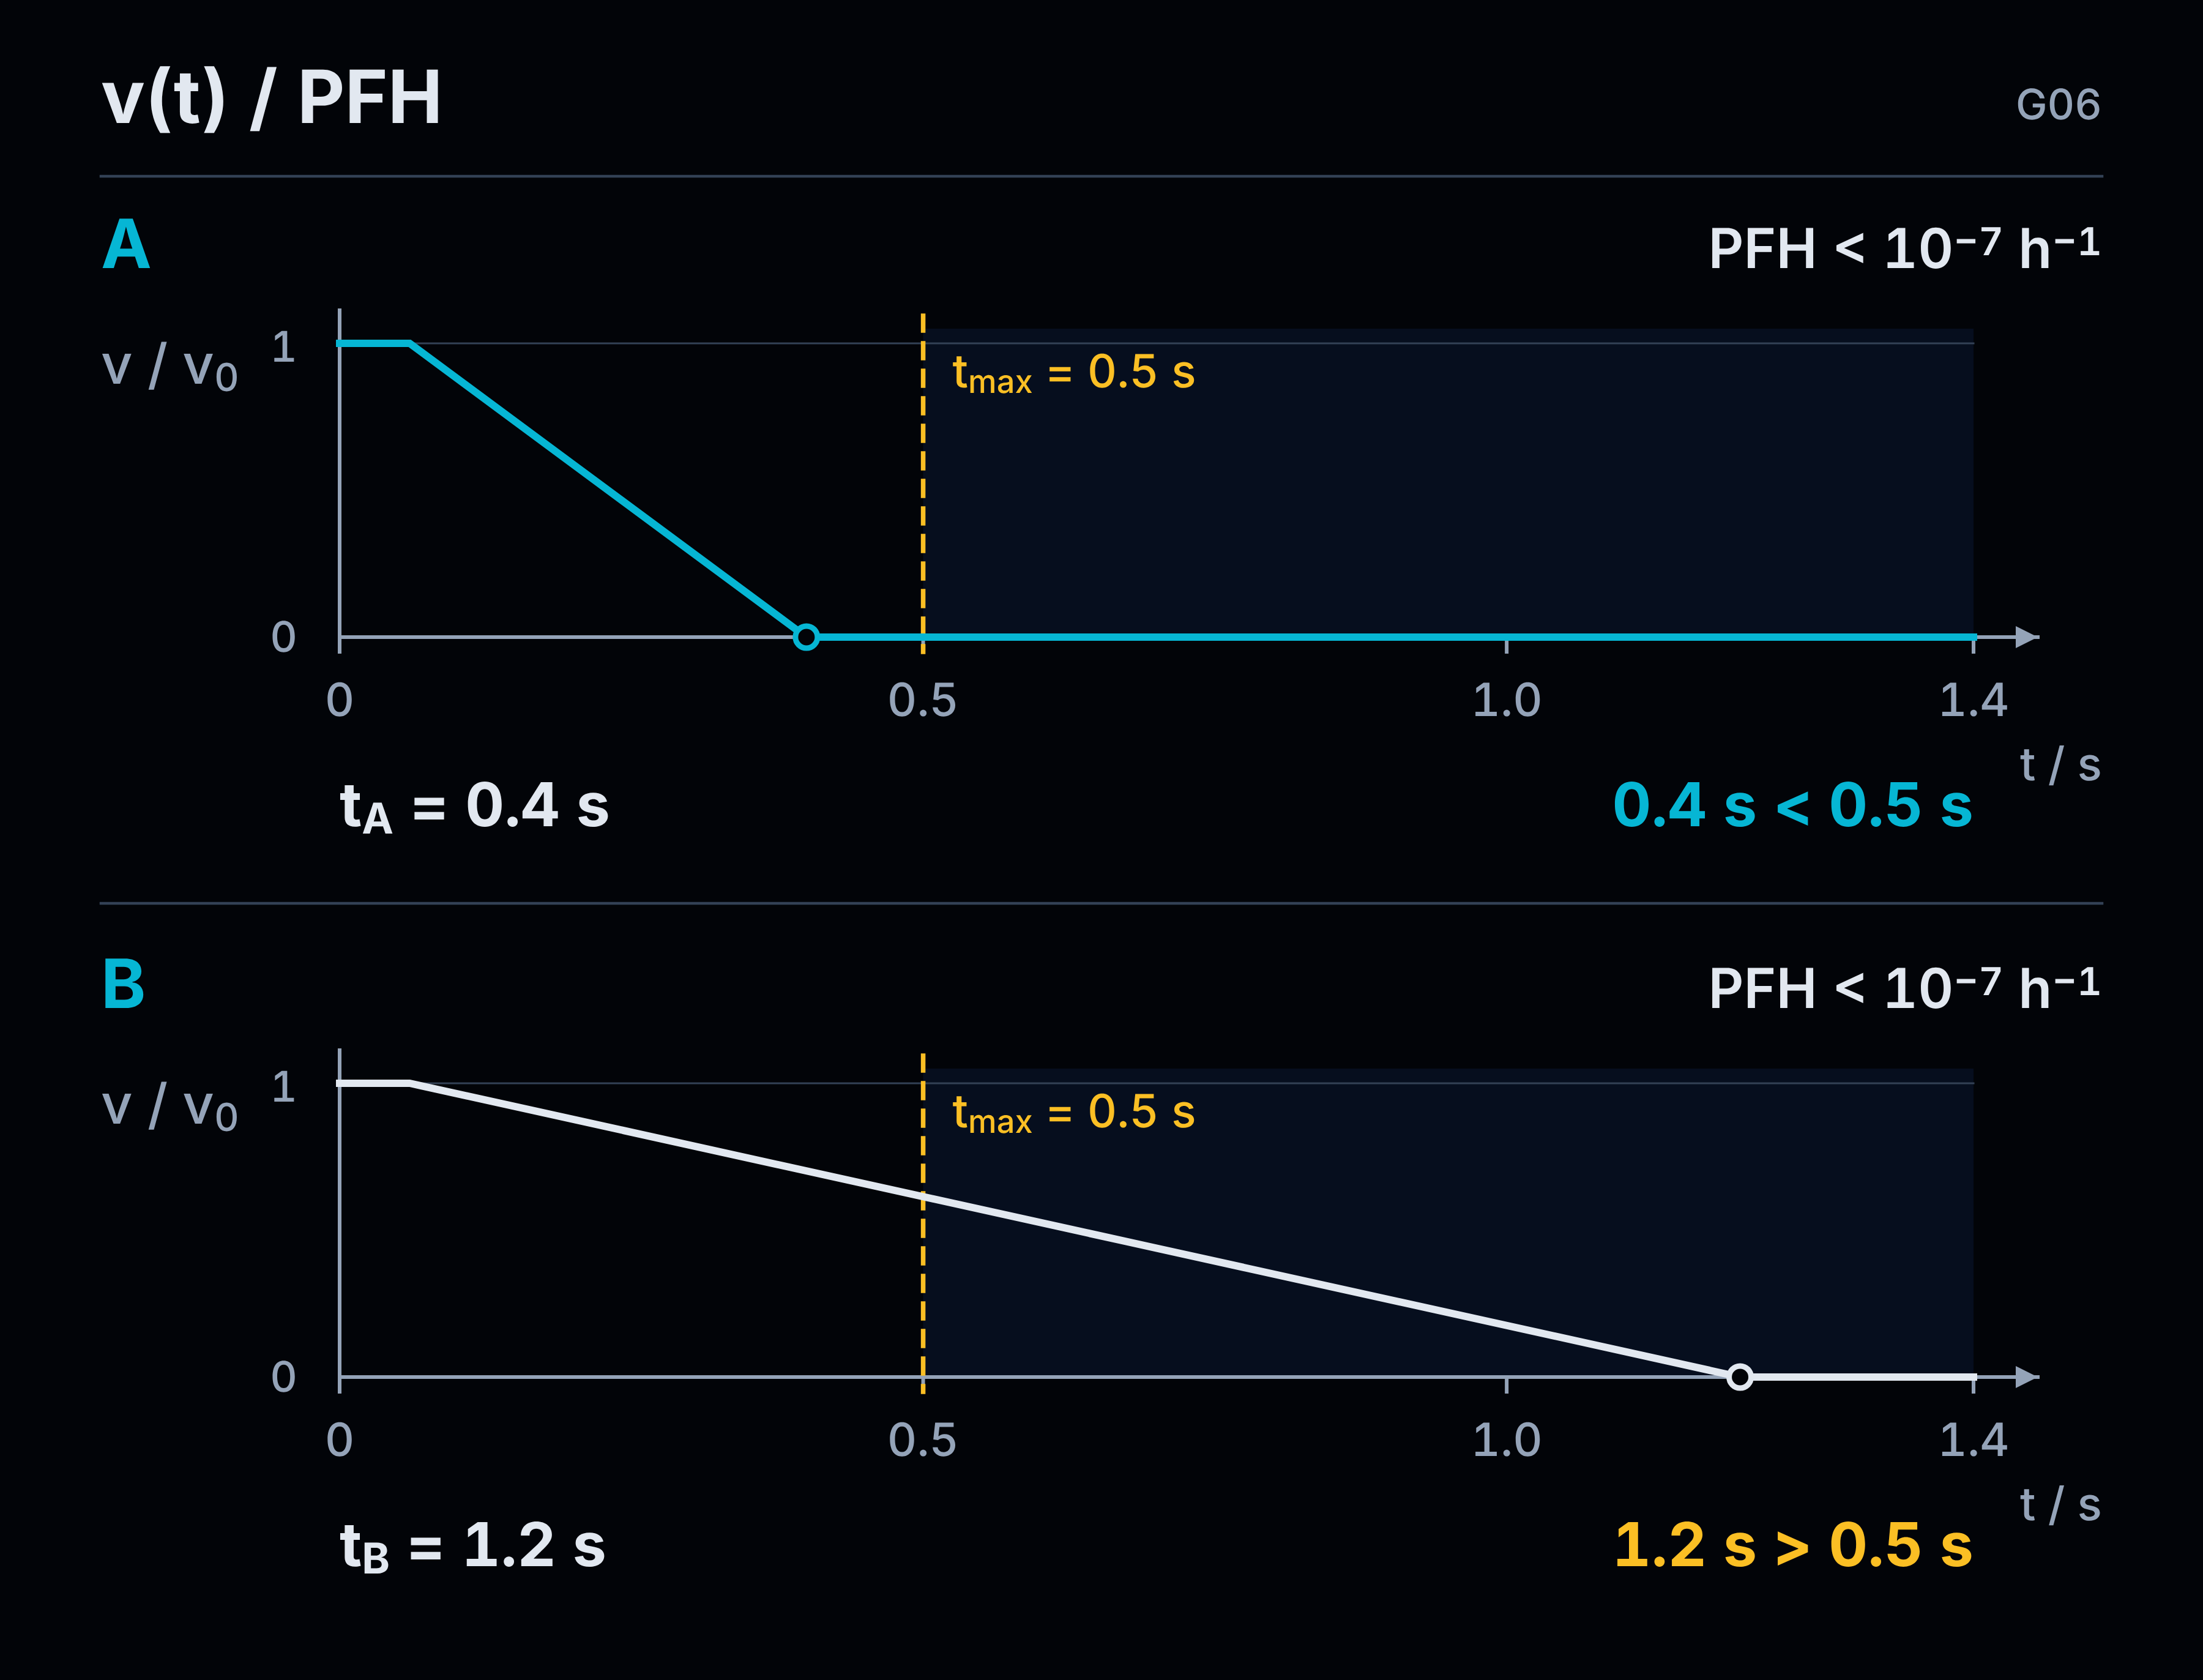
Half a second was required. The machine needs more than one second
For this model example, assume that protecting a particular access point requires a maximum time of 0,5 s from initiation of the function until the hazardous motion stops. This is an assumption for our example, resulting from the selected safeguarding concept—not a universal limit for machinery.
Testing gives a result of 1,2 s.
The system may have very good reliability parameters. It may consistently receive the signal correctly and perform the intended switching action. However, it does not meet the specified time requirement.
The machine reliably does too little. A better PFH will not shorten its coast-down time.
The stopping implementation or the access safeguarding concept must be changed, and the solution must then be tested again. Measuring only the relay response is not sufficient if the requirement concerns the cessation of motion of the entire mechanism.
In the second variant, the time is 0,4 s. The time requirement is met, but this measurement alone does not confirm the PL. Likewise, the PFH result did not confirm the stopping time in the first variant.
These are two separate requirements. Meeting either one does not automatically satisfy the other.
A contactor does not replace task specification either
STO and opening a contactor are not identical actions. In the latter case, the contacts physically interrupt a specific circuit. However, it is necessary to know which circuit and which energy source are being disconnected.
This does not mean that adding a contactor will automatically provide faster stopping or safe holding of an axis. Nor does it mean that every contactor switched off through a control circuit provides isolation suitable for carrying out electrical work.
If the task requires work in a de-energized state and isolation of the equipment, appropriate means of disconnection and protection against reconnection are required. The message “STO active” alone does not confirm such a state. Nor does a command to switch off the contactor.
No torque, no motion, and an isolated circuit are not three names for the same state.
When considering behaviour under fault conditions, we use the scope of the subsystem assessment and its conditions of use. We do not attribute resistance to every possible fault to STO, but neither do we assume that every short circuit in the inverter must cause hazardous motion. Such a conclusion cannot be drawn solely from the absence of isolation.
The choice of solution is determined by the machine tasks and operations, the hazards under consideration, and the required response. Only among solutions that meet these conditions do we compare cost, service life, and ease of operation.
Saving money on contactors may be a good design outcome. It cannot be the safety specification.
Validation is not just another calculation printout
Validation includes analysis and testing. We verify both the functional requirements and the basis of the achieved PL: the data used, the architecture, diagnostics, behaviour under fault conditions, and conditions of use.
We do not begin this work only when the machine is waiting for shipment. The specification must already be checked for completeness and compliance with the intended use. If it merely states “activate STO,” that signal can be verified perfectly while still failing to establish whether the hazard has been controlled.
The absence of a criterion from the specification does not make the requirement easier to meet. It makes it easier to overlook that the requirement has not been met.
Tests must be linked to what is to be demonstrated. They cover the relevant operating modes, signal sequences, restart conditions and foreseeable abnormal situations. For categories 2, 3 and 4, appropriate fault injection tests are also required to verify the operation of the diagnostics and the required response.
Such tests are planned and performed under controlled conditions. They cannot be replaced by randomly disconnecting a single wire during commissioning or by a general assurance that “we tested failures.”
Existing subsystem validation results may be used. There is no need to retest the entire internal design of every purchased device. However, their connections, interfaces and operation in the specific machine must still be verified.
It must also be confirmed that the tested implementation matches the documentation: the devices used, software version, configuration and relevant settings. After a change to the software or solution, the relevant scope of validation must be repeated.
A report does not update itself when new software is uploaded. Even if the file is still named “final.”
One function. Verifiable answers
Instead of another overall “safety — OK,” it should be possible to answer the following questions for each function:
| Question | Where should the answer be found? |
|---|---|
| What are we protecting against, and during which activity? | In the risk assessment, machine limits and description of the intended use. |
| What triggers the function, and what state must it ensure? | In the specification: the response, time, operating modes, and conditions for maintaining the state and restarting. |
| What PLr is required, and what PL has been achieved? | In the justification of the requirement and the assessment of the specific implementation—with subsystem boundaries, method, data and assumptions. |
| Does the as-built machine meet these requirements? | In the results of analyses and tests linked to individual requirements, including those concerning the faults considered. |
| Which implementation do the results apply to? | In the identification of the devices, software, configuration and documentation covered by the verification. |
| What must be maintained during operation? | In the specified limitations and the rules for inspection, maintenance and replacement of parts provided to the user. |
The point is not to create six new forms. The point is to make the answers traceable and verify that they all concern the same function and the same machine.
Not all design documentation has to be provided to the user. However, this must not be used as a reason to withhold from the user information necessary for proper operation.
The boundary between internal documentation and the instructions must not deprive the user of the conditions they are required to meet.
The result must apply to the machine provided to the user—not to the best version of the circuit diagram, the most favorable setting or the software version preceding the latest revision.
A relay will not do the designer’s work
The discussion during the training session was a good starting point for this article because it exposed a mistake that can easily be made in good faith. Reliable devices are selected, their parameters are checked, and it is assumed that the result for the entire function will be equally good.
That will not always be the case.
This cannot be solved either by buying the most expensive devices for every application or by repeatedly stating that everything depends on the risk assessment. We must be able to demonstrate a specific link between the hazard, the requirement, the implemented system and the result of its verification.
If the sum of the PFH values is too high, we change the solution. If the assumed diagnostics have not been implemented, they must be implemented or the system must be reassessed. If the result requires periodic replacements, the user must receive the relevant information. If STO operates but a person can still come into contact with hazardous movement, the protective task has not been accomplished.
Knowing ISO 13849-1 is not about using abbreviations fluently. It is about being able to justify decisions concerning your own machine.
PL e stated for a device is information provided by its manufacturer. PL e for the function must be justified through your own work.
Sources and notes
[1] Scope and edition of the standard. This article refers to PN-EN ISO 13849-1:2023-09, which adopts EN ISO 13849-1:2023 and ISO 13849-1:2023. Official publication details: ISO 13849-1:2023 — Safety of machinery — Safety-related parts of control systems — Part 1: General principles for design. The catalogue page identifies the edition and scope; it does not replace the full text of the standard. Clause numbers in the following notes refer to this edition unless another document is explicitly indicated.
[2] PFH and subsystem combination—introduction and Part 1. PN-EN ISO 13849-1:2023-09, Clause 3.1.58, Table 2, Clauses 6.2.1–6.2.2 and Clause 8: the meaning of PFH, PL ranges, summation of known PFH values in a series connection of previously assessed subsystems, limitation of the result by the lowest subsystem PL, and comparison of PL with PLr. In this edition, Table 2 specifies PL e as PFH < 10−7 h−1, without a lower limit of 10−8. The values 3, 4, 5 and 2, 3, 4 × 10⁻⁸ h−1 are illustrative; the remaining requirements were assumed to be met in these calculations.
[3] Function boundaries, category and PL — Part 2. ISO 13849-1:2023-09, Clauses 5.2.1.3, 5.5, 6.1.1, 6.1.3.2.5–6.1.3.2.6 and 6.2: function specification, division into subsystems, requirements for categories 3 and 4, and the scope of PL assessment. The three example results for category 3 were taken from Table K.1, column DCavg = medium, calculated for 90%, rows MTTFD = 10, 30 and 100 years per channel: 1.36 × 10⁻⁶, 2.65 × 10⁻⁷ and 4.29 × 10⁻⁸ h−1, respectively. Figure G02 distinguishes the power circuit from the reliability model; it does not assign a category or PL to the system shown.
[4] Determining PLr — Part 3. ISO 13849-1:2023-09, Clauses 5.3–5.4 and informative Annex A: Figure A.1, Clauses A.2, A.3.1–A.3.3 and Tables A.1–A.2. The basis includes severity of injury, frequency and duration of exposure, the actual possibility of avoiding or limiting harm, the rule that a single C assessment leads to P2, and guidance concerning 15 minutes and 1/20 of operating time. A.2 provides for a justified and documented reduction of the result by one level where the probability of a hazardous event is low; the method is not the only permitted method, and the relevant type-C standard may specify PLr differently. Requirements are established before selecting the solution; the sequence of examples in the article reflects the sequence of explanation.
[5] Selecting the calculation method — Part 4. ISO 13849-1:2023-09, Clauses 6.1.3.2.1, 6.1.8–6.1.9 and 6.2.1–6.2.3, Figure 12 and Table 9. The simplified procedure requires the subsystem to be equivalent to the relevant architecture and to meet the model assumptions. A different architecture requires a detailed calculation. Table 9 applies to the combination of subsystems when not all PFH values are known; summation applies when all PFH values are known. The example of a discrepancy between the tabulated result and the sum of specific data illustrates the distinct scopes of these methods, not the option to arbitrarily select the more favorable letter. The procedure in 6.1.9 for cases where MTTFD is unavailable has a limited scope and its own conditions.
[6] Diagnostics and CCF — Part 5. ISO 13849-1:2023-09, Clauses 5.2.1.3, 6.1.5–6.1.7, informative Annex E (Table E.1 and Clause E.2) and Annex F (Clauses F.1–F.3, particularly F.3.5, and Table F.1). DC applies to the component under consideration; DCavg accounts for the contribution of components to the dangerous failure rate. Under the method in Annex F, a score of at least 65 points is required; partial implementation of a given measure results in zero points for that item. The training item concerns preparing designers to understand the causes and effects of CCF. The scenarios involving confirmation of the system’s own command, failure to respond, and an operator attendance list are interpretive examples.
[7] Cycles, B10D, MTTFD and T10D — Part 6. ISO 13849-1:2023-09, Clauses 5.2.1.3 j), 5.5, 6.1.4 and C.4.1–C.4.3. Equations C.1–C.3 and C.7: MTTFD = B10D / (0.1 × nop) and T10D = B10D / nop. For the assumed 500 000 cycles/year and B10D = 1 000 000 cycles, the results are 20 years and 2 years. What matters is the operation of the specific component in its application, not merely the number of times a single initiating device is used. These results do not in themselves determine the PL of the subsystem or function.
[8] Limitations and servicing — Part 7. ISO 13849-1:2023-09, Clauses C.4.2–C.4.3, 10.9, Clause 11 and Clauses 12–13: limitation of component use, communication of replacement conditions, validation of the completeness of the operating instructions, service availability, and revalidation after repair or modification. The schedule involving five units and four replacements applies to the assumed ten-year period, replacements every two years, and termination of use in the tenth year. In this scenario, the relay’s one million cycles constitute an assumed service limit, not automatically its B10D. The calculation of the change in operating rate after one year accounts for the 500 000 cycles already completed and assumes uniform operation in subsequent months.
[9] Validation — Part 8 and conclusion. ISO 13849-1:2023-09, Clauses 5.2.1.3, 5.2.2.2, Clause 8, Clauses 10.1–10.6, 10.8–10.9 and Clauses 12–13: functional requirement and PLr, analysis and testing, appropriate fault injection for categories 2, 3 and 4, validation of subsystem integration and software, traceable results, and information for the user. The times of 0.5 s, 1.2 s and 0.4 s are assumptions used in the example, not limits specified in the standard. The table of questions organizes the evidence; it is neither a complete validation plan nor a mandatory form.
[10] STO, stopping and isolation — supplement to Part 8. PN-EN 60204-1:2018-12, Clauses 5.4–5.6 and 9.2.2–9.2.3.3: distinction between prevention of unexpected start-up, isolation functions and stopping categories, and selection of the response based on the risk assessment and machine operation. This edition implements EN 60204-1:2018 and IEC 60204-1:2016 with European modifications. Details of the underlying publication: IEC 60204-1:2016 — Safety of machinery — Electrical equipment of machines — Part 1: General requirements. The drive standard referenced in Clause 5.2.2.2 of ISO 13849-1:2023 is IEC 61800-5-2:2016 — Adjustable speed electrical power drive systems — Part 5-2: Safety requirements — Functional; the link identifies this publication and does not mean that the article provides a complete review of it. No universal motion scenario following an arbitrary short circuit in the drive has been assumed. The characteristics of the specific drive must be verified within the scope of its assessment and under its application conditions.
[11] Citing standards in the declaration — introduction.Directive 2006/42/EC — Annex II, Part 1, Section A, points 7–8 and Regulation (EU) 2023/1230 — Annex V, Part A, point 7: references to the standards and technical specifications applied. The Regulation also provides for identifying the parts applied where standards are used only in part; pursuant to Article 54, it generally applies from 20 January 2027. The comment in the introduction concerns presenting a citation as confirmation of work that was not performed; it does not assume that merely possessing a standard or entering its number confirms the conformity of the machinery.
[12] Nature of the examples. The training discussion in the introduction is based on the author’s experience. The remaining configurations, data and scenarios presented as examples elaborate on the requirements and relationships described in the standards; they are not attributed to the company involved in the training or to specific products. No illustration, table or individual calculation replaces the assessment and validation of the actual function. The applicable editions of the standards, rather than articles published by equipment manufacturers, are the source of the technical requirements. This document does not constitute a review of the current list of harmonised standards.