The risk graph in machine risk assessment is one of the most useful tools engineers misuse. Green calms people down. Red gets everyone moving. The middle band starts the conversation many teams would rather avoid. But ISO 12100 does not care whether a cell in a table looks comforting. It asks a harder question: was the risk adequately reduced?
That is why the Graph method, described in ISO/TR 14121-2 as one of the tools for risk estimation, is genuinely useful only when you treat it as a decision trail, not as an automatic permission slip. It leads you through S/F/O/A: severity of possible harm, frequency and/or duration of exposure, probability of a hazardous event, and possibility of avoiding or limiting harm. The output is a risk index. Useful, yes. Final answer, no.
That distinction matters because risk estimation is qualitative. Two competent assessors, or two competent teams, can look at the same scenario and rate exposure, probability, or avoidance differently. ISO/TR 14121-2 is explicit on this point: detailed results do not have to be identical when different teams assess similar situations. The value is not fake mathematical precision. The value is process discipline: was the scenario described correctly, were all elements of risk considered, and can the decision be defended later?
Color is not a verdict. A risk graph does not give you an alibi. It gives you a trail of decisions that must still survive technical scrutiny.
Why the risk graph in machine risk assessment is not an acceptance table
The biggest trap with the Graph method is that it looks almost too easy. Pick severity. Pick exposure. Pick probability. Pick avoidance. Out comes RI. RI 2 looks calm. RI 5 looks ugly. RI 3 or RI 4 starts the debate.
But that result is not a laboratory measurement. It is still a qualitative estimate. One assessor may judge exposure as occasional, another as frequent. One may believe the operator can realistically avoid harm, another may conclude that once the event starts, there is no meaningful escape. That does not make the method weak. It means its strength is in structuring reasoning, not pretending to replace it.
So the Graph result should never work like a sentence handed down by a machine. It should work like a traceable route from a concrete hazardous situation to a concrete risk index. Then comes the more important question: after the protective measure was applied, was the residual risk adequately reduced?
This is where real ISO 12100 thinking starts. A medium result may be defensible if the machine uses the right protective measure required by a relevant Type-C standard, aligned with the state of the art, properly implemented, verified, and documented. On the other hand, a low result is not always a good reason to do nothing. If a simple design change removes the problem at negligible cost, without harming usability or creating a new hazard, leaving the risk in place just because it came out low is not solid engineering. It is lazy engineering dressed up as method.
The hierarchy of risk reduction still applies. First look for inherently safe design measures. Then safeguarding and complementary protective measures. Then information for use about residual risk. The Graph method does not suspend that logic. It shows where that logic must be documented.
Before S/F/O/A, define the scenario
The Graph method only starts making sense when you know what you are actually assessing. One of the most common failures in machine risk assessment is scoring the hazard source instead of scoring a real scenario.
Moving parts, pneumatic power, sharp edges, high temperature, stored energy: those are hazard sources. They are not yet risk scenarios. By themselves, they do not tell you who is exposed, when exposure occurs, in which phase of the machine life cycle, during which task, or how harm can arise.
Before assigning S/F/O/A, you need a short but concrete scenario description that covers:
- the hazard, meaning the potential source of harm,
- the hazardous situation and/or hazardous event, consistent with the ISO 12100 approach,
- the possible harm, such as injury or damage to health,
- the task performed by the person,
- the machine life phase, and
- the exposed person.
In practice, the hazardous situation describes the circumstances in which a person is exposed to the hazard source. The hazardous event describes the event that can lead to harm. Depending on the case, you may need one of those elements or both. Skip that step, and the Graph method becomes an elegant form with weak meaning.
A moving part during normal operation, with the operator outside the hazard zone and access blocked by a guard, is not the same scenario as the same moving part during jam clearing, when the operator opens access and works close to the drive. Same hazard source. Different exposure. Different event sequence. Different risk.
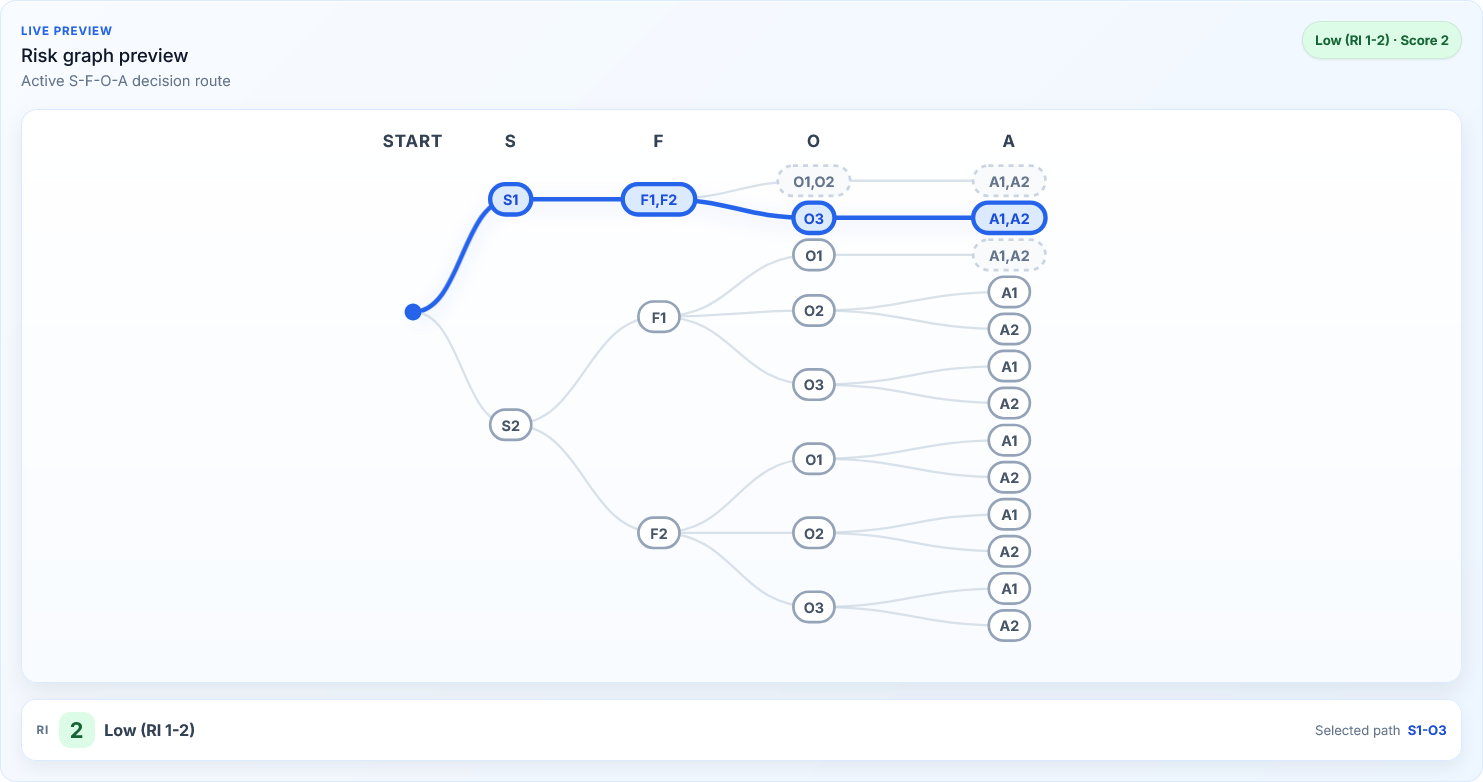
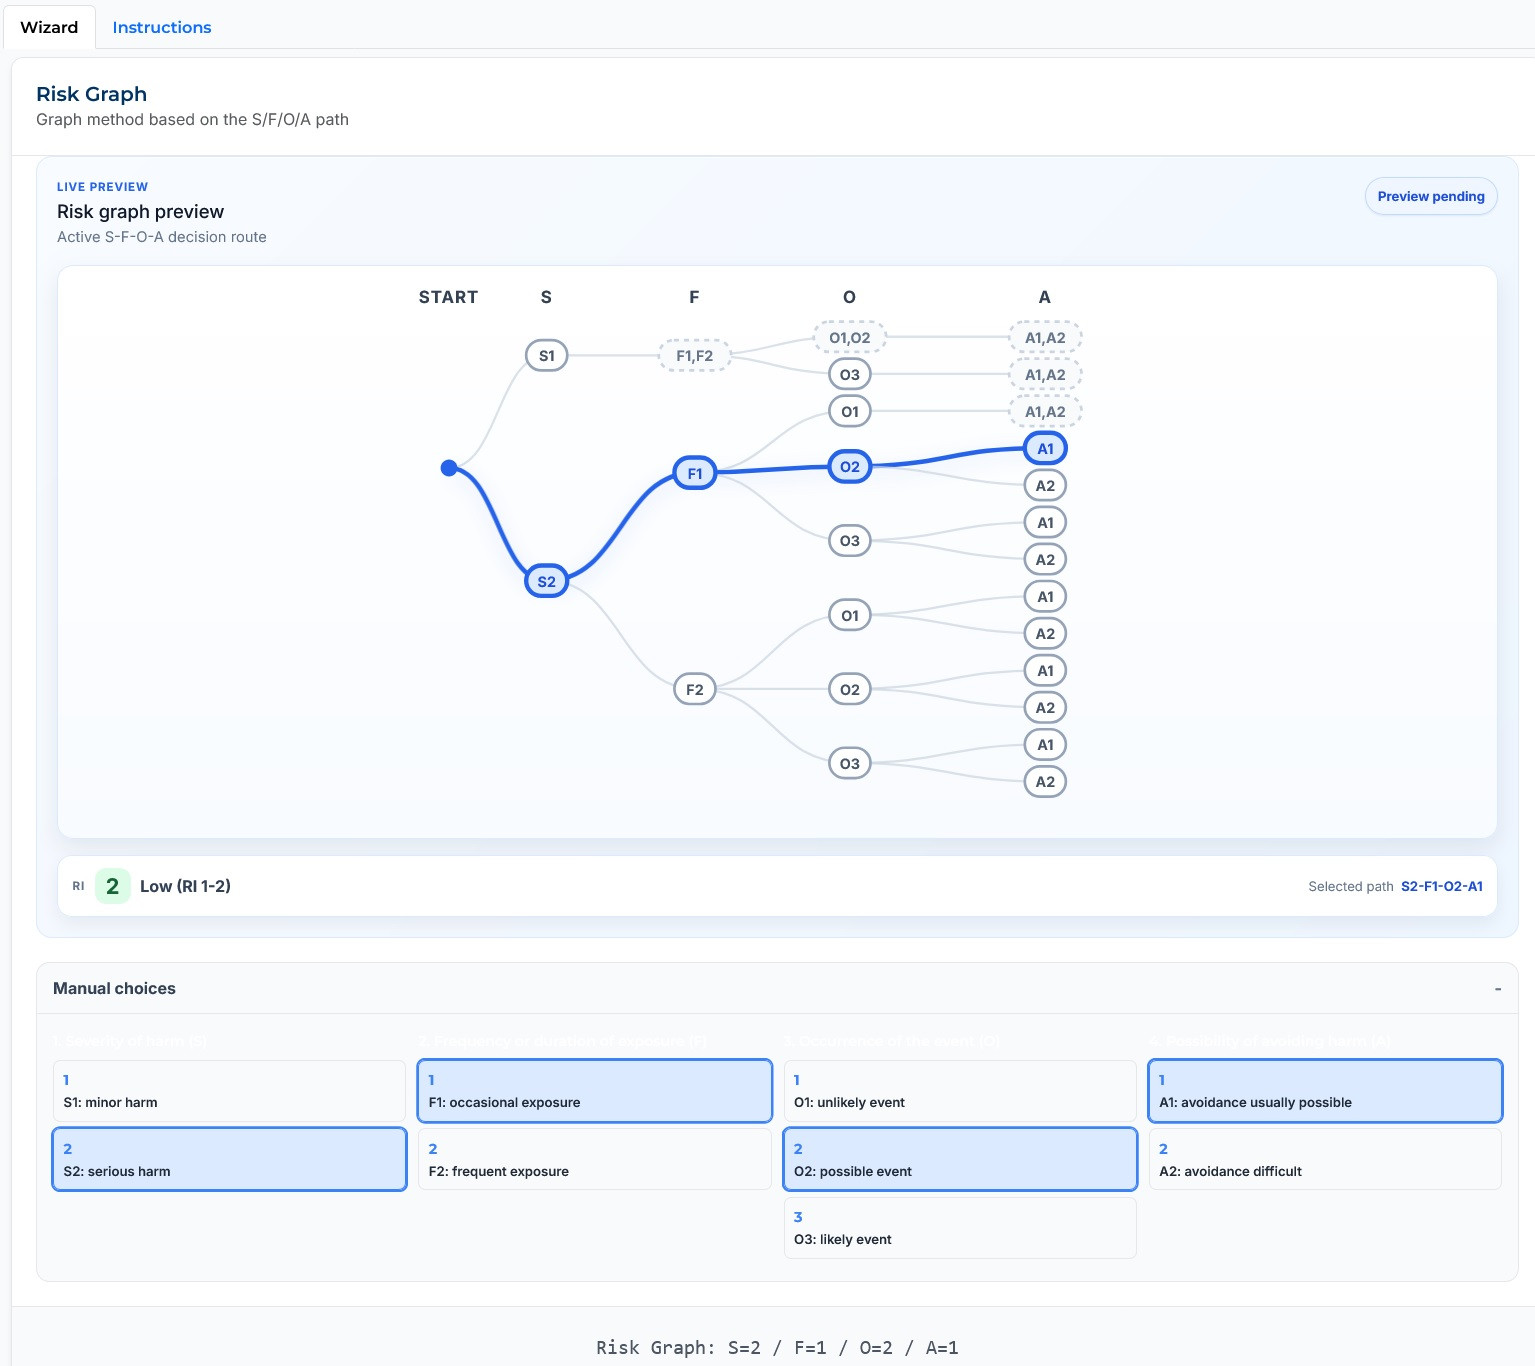
Example 1: low risk you still should not leave alone
Take a simple case. A machine guard has a sharp sheet-metal edge. The operator may touch it during daily cleaning, setting, or material replenishment. The likely harm is a minor cut. Exposure time is short. The hazardous situation is hand or forearm contact with the sharp edge while performing a routine task. Avoidance is usually possible.
| Parameter | Rating | Justification |
|---|---|---|
| S | S1 | Possible harm is slight: a minor cut likely requiring no more than basic first aid. |
| F | F2 | The operator performs the task regularly, but each individual exposure is short. |
| O | O3 | Contact with the sharp edge is possible, but not frequent, and it depends on a specific hand movement. |
| A | A1 | In the classic Graph approach described in ISO/TR 14121-2, A covers both avoiding harm and limiting its effect. Here the operator will usually notice the edge and pull back, so A1 is reasonable even if the boundary is not perfectly sharp in practice. |
For S1, F2, O3, A2, the Graph method can produce a low result: LOW, RI = 2. And that is exactly where people get fooled. Low does not automatically mean leave it alone.
| Element | Weak approach | Better approach |
|---|---|---|
| Graph result | RI is low, so we leave it. | RI is low, but the reduction is simple and worth doing. |
| Protective measure | No action. | Remove the sharp edge by a design change. |
| Rationale | “The risk is not high.” | “The risk was reduced by a simple inherently safe design measure with no negative effect on function or usability.” |
| Conclusion | The color closed the topic. | The decision followed risk reduction logic. |
If the fix is a chamfer, a protective strip, a better bend radius, or cleaner finishing of the part, the cost is negligible. Function does not suffer. Operation does not get harder. No new hazard appears. In that situation, leaving the risk in place because the box is green is a poor engineering choice. ISO 12100 is about reducing risk as far as practicable by appropriate measures, with due regard to machine function, usability, the state of the art, and practical constraints. It is not about finding the lowest color that lets you stop thinking.
Example 2: medium risk that may be adequately reduced
Now flip the situation. Imagine a machine where a working element must remain active and, in certain operating conditions, remain accessible for functional reasons. Possible harm is severe, so S stays high. You can restrict access, reduce the likelihood of contact, use guards, barriers, interlocking, minimum distances, control functions, and information for residual risk. But you may not be able to push the result into the lowest band without wrecking the machine function.
A clear example comes from Type-C standards for agricultural machines such as combine harvesters and similar equipment. The sector is different from a typical factory line, but the logic is the same. Consider a rear straw beater, a straw spreader, or a chaff spreader. You have moving working tools, possible contact with rotating elements, and the possibility of objects being ejected. The possible harm can still be severe. A relevant Type-C standard does not say, “make the cell green.” It specifies concrete protective measures: guards, barriers, fixed machine parts, minimum distances to the tool path, safety signs, instructions, and verification requirements.
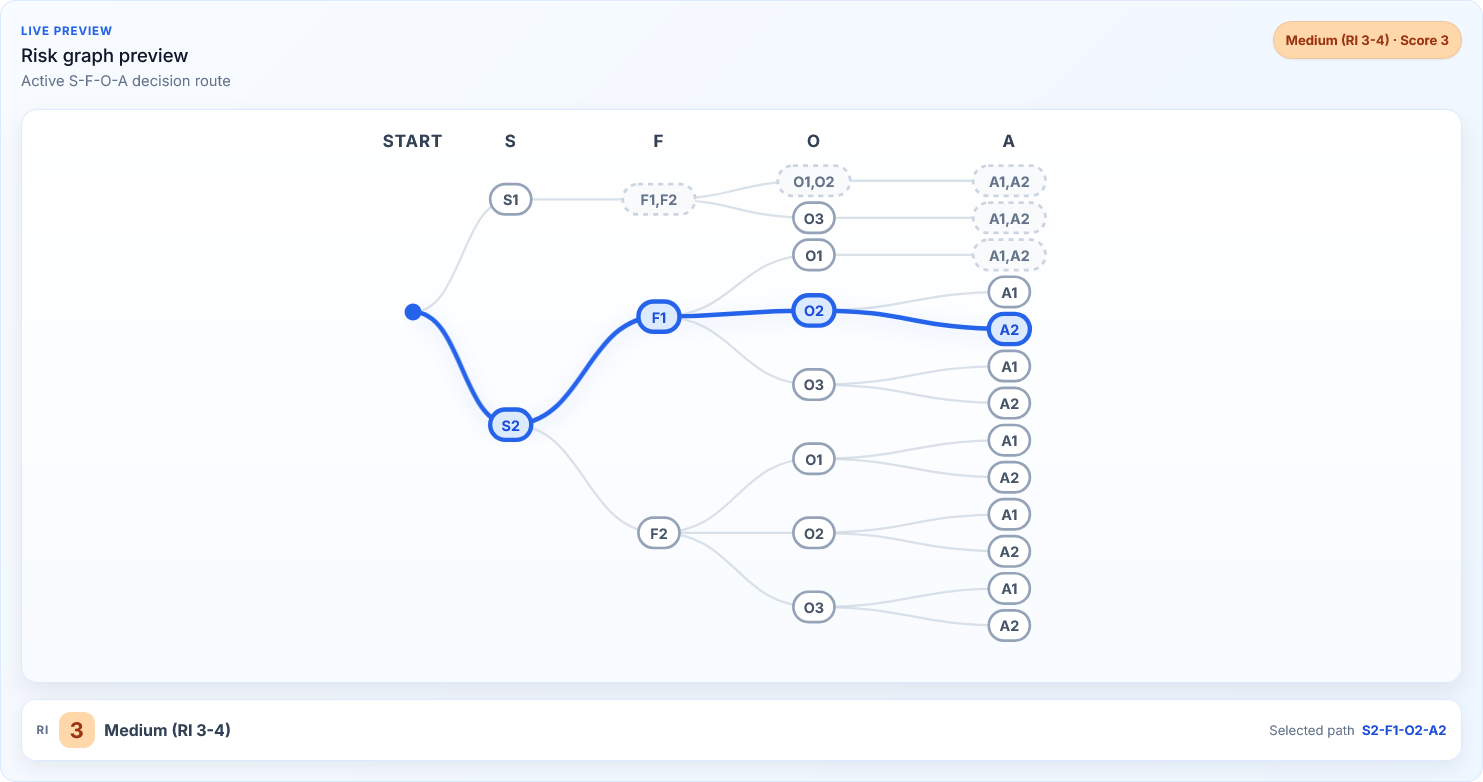
| Parameter | Rating | Justification |
|---|---|---|
| S | S2 | Contact with a rotating tool or an ejected object can lead to severe injury. |
| F | F1 | Access to the hazard zone in normal operation is limited by guards, barriers, and the machine design. |
| O | O2 | A hazardous event is unlikely because the protective measures reduce exposure and accidental contact, but it cannot be excluded completely. |
| A | A2 | When fast-moving elements or ejected objects are involved, the ability to avoid or limit harm is restricted. |
That combination can still lead to Graph level 3, a medium result. That does not automatically mean the design is wrong. It means residual risk remains and must be justified properly.
A weak record says: residual risk medium, acceptable. A defensible record says this instead: after applying the protective measures required by the relevant Type-C standard, residual risk remains at level 3 according to the selected Graph method, mainly because of the severity of possible harm and the functional necessity of the working element. The implemented measures restrict access to the hazard zone, reduce the probability of accidental contact, and provide the required residual-risk information. Further reduction was reviewed, but no additional measure was identified that would reduce risk without impairing machine function, reducing usability, or creating new hazards.
That is a completely different standard of reasoning. The decision is not defended by saying that medium still looks survivable. It is defended by showing the right protective measure, the right standard, verification, and a real explanation of why further reduction is not technically or functionally justified.
Example 3: one scenario, two different results
The third example exposes the subjectivity inside the estimate itself. Suppose the task is clearing a jam. The hazard source is moving parts. The hazardous situation appears when the operator intervenes in the machine zone. The hazardous event may be unexpected motion, release of stored energy, restart, or contact with a part that has not stopped yet. Possible harm may be crushing, drawing-in, cutting, or hand injury.
One team may assume jams are rare, operators are experienced, the procedure requires stop and energy isolation, and access is restricted. That team will probably score exposure and probability lower. Another team may look at the same process and see something very different: minor jams several times per shift, production pressure, a guard that gets in the way, and routine bypass of LOTO. That team will score exposure and probability higher.
Who is right? You do not settle that by clicking the Graph again. You go back to facts from the real machine, the real task, and the real behavior on the floor.
The hardest question in machine risk assessment is not whether the result came out low. It is whether you can defend that the risk was adequately reduced.
| Question | Why it matters |
| How often do jams actually occur? | That directly affects F, which is exposure. |
| Does the operator have to enter the hazard zone? | Stopping the machine does not always eliminate exposure. |
| Was energy isolated and dissipated? | The risk may come from stored energy, not only visible motion. |
| Does the working element stop immediately? | Run-down time can still create a hazardous event. |
| Can the protective measure be bypassed easily? | Real usability affects real human behavior. |
| Is the procedure actually followed in production? | A document does not always describe the real task. |
| Can the design be changed to reduce the number of jams? | The best risk reduction often removes the need for intervention altogether. |
What the risk graph in machine risk assessment can and cannot do
These examples point to one simple conclusion. The Graph result is not permission to leave risk in place. It is a record of how you arrived at a decision. Once you have the result, you still need to ask:
- Was the scenario described correctly?
- Do the selected S/F/O/A values match actual machine use, not imagined use?
- Was the hierarchy of risk reduction applied properly?
- Is there a simple protective measure that was ignored?
- Does a relevant Type-C standard specify a concrete protective measure?
- If no Type-C standard applies, was a Type-B standard or another justified technical solution used properly?
- Was the protective measure verified, not just declared?
- Was residual risk described and justified?
That is when the method starts doing real work. Not as a colorful matrix for closing meetings, but as a decision path that can be defended technically, against the standards, and with plain engineering common sense.
How to document the risk graph in machine risk assessment so it is more than color
The biggest value of the Graph method is not the final RI. It is the path that leads to it. If that path is missing from the file, the result may look professional while saying almost nothing.
A solid record should include:
- a scenario description, not just the name of the hazard source,
- the exposed person and the task during which exposure occurs,
- a clear distinction between hazardous situation and hazardous event where relevant,
- justification for each S/F/O/A choice,
- the protective measures used to reduce risk,
- a reassessment after those measures are implemented,
- a description of residual risk,
- the applicable Type-C standard, Type-B standard, or another justified technical basis, and
- an explanation of why further reduction was not implemented.
That kind of documentation lets another competent person follow the logic. It also lets you defend the decision later, which matters in technical review, in incident analysis, and in the documentation expected around conformity work under 2006/42/EC.
In software, the useful part of the Graph path is not that it paints a box. It is that it shows how the assessor moved through S/F/O/A, what changed after each protective measure, and why the final residual risk was considered adequately reduced or not.
Conclusion: Graph does not replace thinking
The Graph method is a good tool for machine risk assessment when it is used within the logic of ISO 12100. It structures risk estimation, reduces random judgment, and forces the team through four necessary questions: how severe the harm can be, how often a person is exposed, how likely a hazardous event is, and whether harm can be avoided or limited.
But it does not answer the final question on its own. A low result does not always mean you can leave the issue alone. A medium result does not always mean the design failed. The worst mistake is to treat the color as the decision.
Good machine risk assessment does not end at RI 1, RI 2, or RI 3. It ends when the designer can show what was assessed, why those parameters were selected, which protective measure was applied, which elements of risk were reduced, and why the remaining residual risk was judged to be adequately reduced. The Graph method should not replace thinking. It should force thinking into a form you can defend.