We have expanded the risk assessment module in Safety Software with new, configurable machine risk assessment methods. HRN is still available, and now teams can also work with Risk Score, Graph, and Matrix. That matters in the real world, where one project, one customer, or one business unit may expect a different way of estimating and presenting risk than the next. ISO 12100 does not tell you to lock yourself into one table forever. It expects a disciplined process: define the limits of the machine, identify each hazard and hazardous situation, analyze the hazardous event, select protective measures, and justify the residual risk.
That is the point of this update. The method should support the process, not replace it. If the result looks tidy but nobody can explain how it was reached, you do not have control. You have a number nobody can defend.
Why machine risk assessment methods must support the process
In many companies, machine risk assessment still begins with a spreadsheet that somebody built years ago, copied twenty times, and adjusted for the next machine. One file describes parameters one way. Another uses different thresholds. A third has translations that do not match the final report. By the time the assessment is signed off, a result appears in the document, but the path to that result is not always clear.
That is where risk assessments start to drift. Not because the team lacks engineering competence, but because the method lives in scattered files instead of a controlled system. When parameters, thresholds, labels, translations, and decision paths are spread across personal spreadsheets, consistency goes first. Auditability usually follows.
Safety Software addresses that problem with a central configuration catalog. The method logic is managed at system level, not buried in a private spreadsheet. Parameters, thresholds, labels, translations, and decision paths stay aligned across projects and across the final report. The team can work with the method it actually needs, while the organization keeps one coherent way to document decisions.
This is not about adding extra calculators just to produce more numbers. It is about making risk estimation part of a structured, auditable process. That difference matters when the assessment comes back months later and someone asks the obvious question: why did we accept this level of risk, and based on what exactly?
How machine risk assessment methods work in Safety Software
The risk assessment module now includes additional methods and configuration mechanisms. That gives teams more flexibility without turning the process into a patchwork. You can choose the method that fits the project, the customer requirement, or the internal procedure, while keeping the documentation model consistent.
HRN with fractional FE values
HRN remains one of the available methods, and our implementation supports fractional values such as FE = 0.5 without losing precision in the result or in the final report. That is not a cosmetic detail. HRN is useful precisely because it lets teams differentiate the weight of individual parameters with more nuance. If the tool forces rough rounding, the method becomes less honest than the engineering assumptions behind it.
With fractional FE support, the team does not need to distort the input just because a spreadsheet or a basic calculator cannot handle a more precise entry. The result can reflect the agreed assumptions more accurately, and the final report still shows the calculation clearly.
Risk Score for straightforward S/F/O/A scoring
Risk Score is a simple point-based method built around S/F/O/A. It fits teams that want a more intuitive model but still need consistent thresholds, labels, and descriptions in the documentation. That combination matters. Simplicity is useful only if the logic remains visible and repeatable.
In practice, Risk Score gives users a clean view of the input parameters, the calculated result, and the risk classification in one organized model. It is easy to follow, easy to explain, and much easier to keep consistent across multiple projects than a loose collection of local spreadsheets.
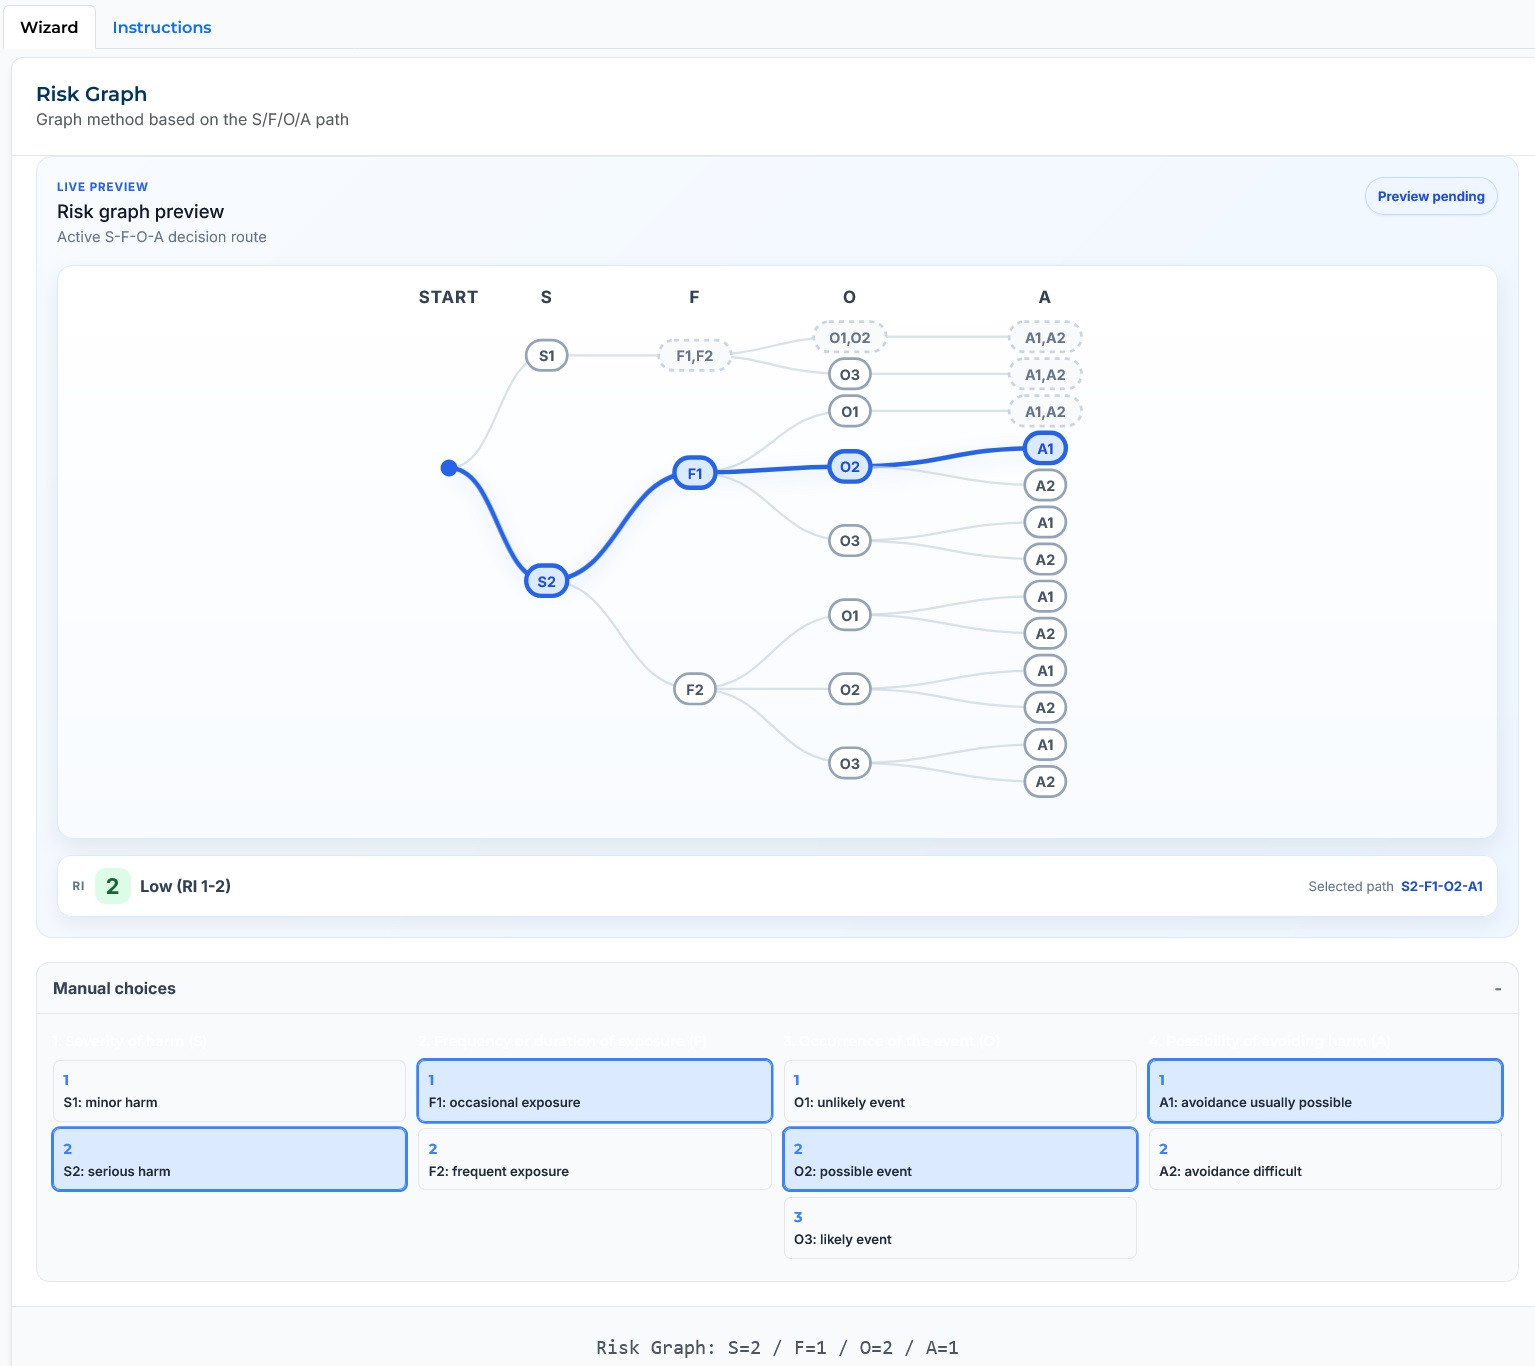
Graph with decision paths to RI 1–6
Graph uses S/F/O/A decision paths to reach a result from RI 1–6. Many automation engineers will find that logic familiar because it resembles the step-by-step question flow they know from work around safety functions. Here, though, it is used for risk estimation within machine risk assessment.
The user moves through the key parameters one by one: severity of possible harm, frequency or duration of exposure, probability of the hazardous event, and the possibility of avoiding or limiting the harm. That approach works especially well when the team wants to see not just the final level of risk, but also the route that led there. The result is not some magic number from a table. It comes from explicit answers and explicit assumptions.
That visibility is valuable in design reviews, customer discussions, and audits. When a method exposes the decision path, disagreements can be addressed where they actually exist: in the assumptions, not in the formatting of the report.
Matrix for fast, familiar classification
Matrix is the classic risk matrix based on the relationship between severity of harm and probability of occurrence. Most technical teams know it. Most can use it quickly. That is exactly why it remains relevant. A familiar method lowers friction when the organization needs speed and clarity.
But in Safety Software, Matrix is not just a loose table pasted into a document. Its thresholds and labels are configurable, and the outcome stays aligned with the final report. That means teams can keep the familiarity of the matrix without accepting the usual mess that comes from manually maintained versions floating around the organization.
Machine risk assessment methods in one auditable environment
The most important change is not simply that there are more methods. It is that different machine risk assessment methods can now operate inside one environment and within the same documentation process. That is the real upgrade.
An organization can choose the method according to the project, the customer, or its own procedure, while still recording decisions in a common structure. The system stores the method configuration, input parameters, calculated result, risk category, and explanation of the calculation. So the final report does not just display the outcome. It shows how the outcome was obtained.
This becomes critical when the assessment returns later. And it always returns later. Maybe during an audit. Maybe after a machine modification. Maybe because a protective measure changed, a design was updated, or the team needs to review residual risk. At that point, the method, the parameters, and the thresholds should not be trapped in one engineer's spreadsheet. They should be part of documentation that can be reconstructed, checked, and defended.
That is what auditable really means in practice. Not a polished file. A clear trail from assumptions to result.
Choosing machine risk assessment methods without losing control
The new methods give teams more flexibility, but they do not change the core rule behind Safety Software: machine risk assessment is not just a mathematical exercise. A numeric result, an index, or a color in a matrix is only one part of the process.
The hard part is still the engineering work. You still need to define the limits of the machine correctly. You still need to identify the hazard, describe the hazardous situation, analyze the hazardous event, select suitable protective measures, and justify the residual risk. If those steps are weak, no method will rescue the assessment. It will only make a weak assessment look more formal.
That is why the methods were designed to support organizational flexibility and process auditability at the same time. A team can use the method it knows. A customer can ask for a familiar format. An internal procedure can require a specific model. Fine. But the result still belongs to one coherent technical record, not to a disconnected tool on somebody's desktop.
The method helps the team make decisions. It should never replace engineering judgment.
What this means for users
With the new options in Safety Software, users can:
- choose a risk estimation method that matches the project,
- use HRN with fractional FE values,
- work with the point-based Risk Score method,
- carry out assessments with Graph and its decision paths,
- use the classic Matrix approach in a controlled system,
- keep thresholds, labels, and translations consistent,
- transfer results to the final report in a clear form,
- reduce the gap between working assessment data and final documentation.
This is another step toward a more configurable, repeatable, and auditable machine risk assessment process. And that is exactly how it should be. Good documentation should not depend on who last edited the spreadsheet. It should come from a process the team can reproduce, verify, and stand behind.